Compute Probability of Detecting True Subgroup
Source:R/truefind_asymptotic.R
compute_detection_probability.RdCalculates the probability that a true subgroup with given hazard ratio will be detected using the ForestSearch consistency-based criteria.
Usage
compute_detection_probability(
  theta,
  n_sg,
  prop_cens = 0.3,
  hr_threshold = 1.25,
  hr_consistency = 1,
  method = c("cubature", "monte_carlo"),
  n_mc = 100000L,
  tol = 1e-04,
  verbose = FALSE
)
Arguments
- theta
Numeric. True hazard ratio in the subgroup. Can be a vector for computing detection probability across multiple HR values.
- n_sg
Integer. Subgroup sample size.
- prop_cens
Numeric. Proportion censored (0-1). Default: 0.3
- hr_threshold
Numeric. HR threshold for detection (e.g., 1.25). This is the threshold that the average HR across splits must exceed.
- hr_consistency
Numeric. HR consistency threshold (e.g., 1.0). This is the threshold each individual split must exceed. Default: 1.0
- method
Character. Integration method: "cubature" (recommended for accuracy) or "monte_carlo" (faster for exploration). Default: "cubature"
- n_mc
Integer. Number of Monte Carlo samples if method = "monte_carlo". Default: 100000
- tol
Numeric. Relative tolerance for cubature integration. Default: 1e-4
- verbose
Logical. Print progress for vector inputs. Default: FALSE
Value
If theta is scalar, returns a single probability. If theta is a vector, returns a data.frame with columns: theta, probability.
Details
This function computes P(detect | theta) using the asymptotic normal approximation for the log hazard ratio estimator. The detection criterion is based on ForestSearch's split-sample consistency evaluation:
The subgroup HR estimate must exceed hr_threshold on average
Each split-half must individually exceed hr_consistency
The approximation assumes:
Large sample sizes (CLT applies)
Var(log(HR)) ~ 4/d per treatment arm
Independence between split-halves (conditional on true effect)
Examples
# \donttest{
# Single HR value
prob <- compute_detection_probability(
theta = 1.5,
n_sg = 60,
prop_cens = 0.2,
hr_threshold = 1.25
)
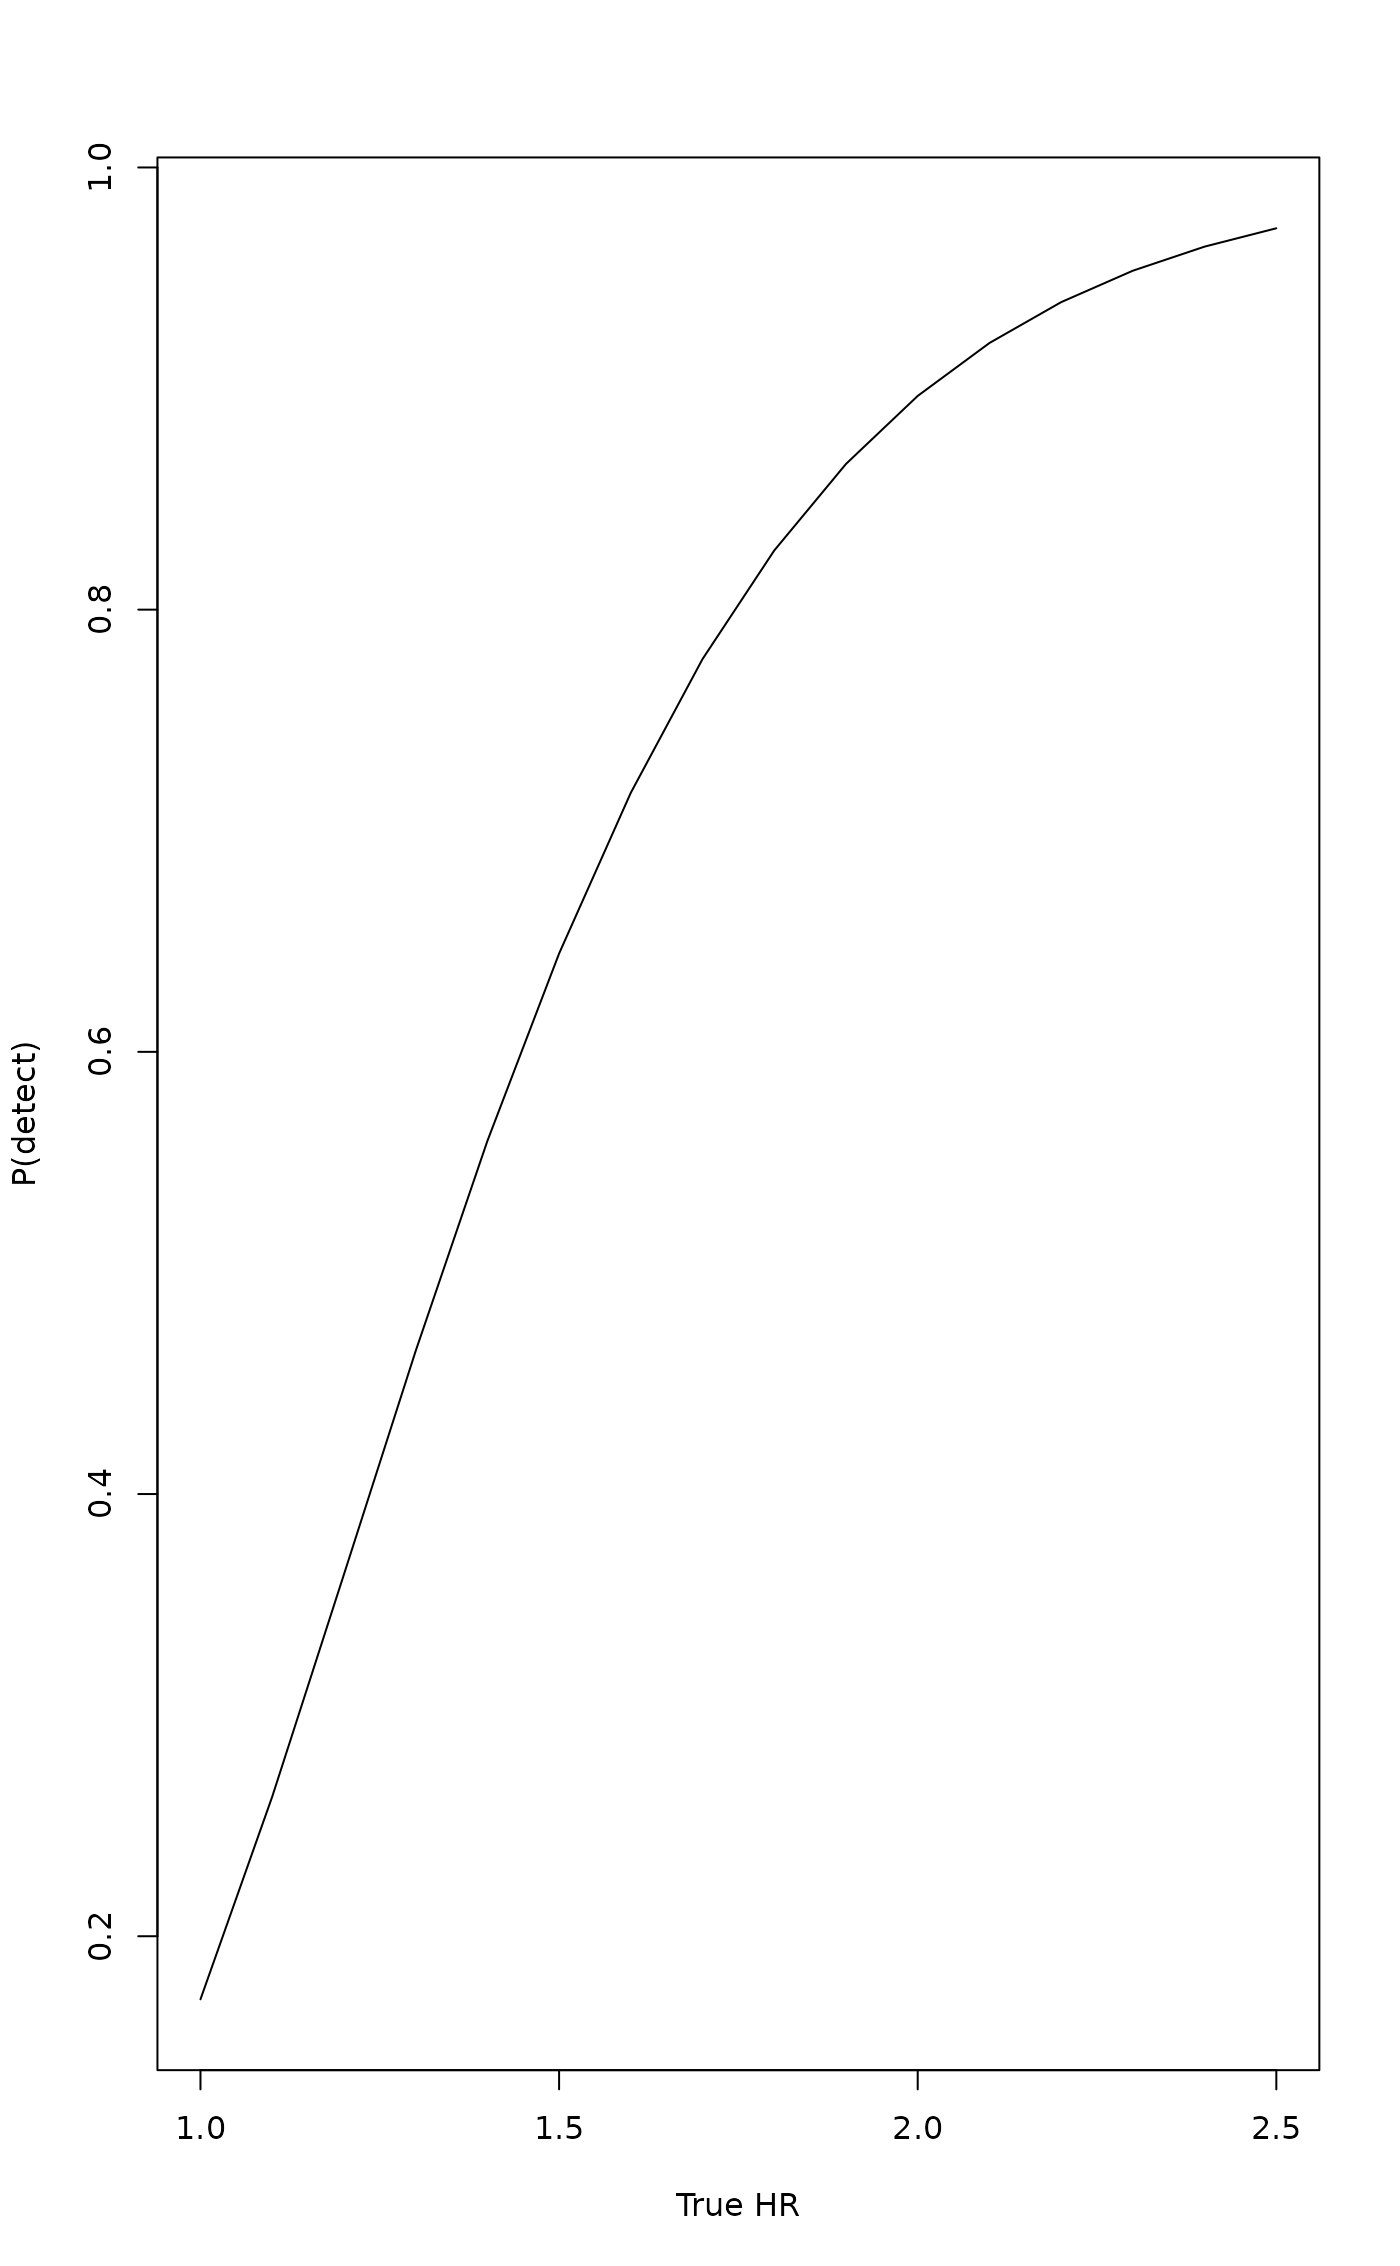
# Vector of HR values for power curve
hr_values <- seq(1.0, 2.5, by = 0.1)
results <- compute_detection_probability(
theta = hr_values,
n_sg = 60,
prop_cens = 0.2,
hr_threshold = 1.25,
verbose = TRUE
)
#> Computing probability for theta[1] = 1.000
#> Computing probability for theta[11] = 2.000
# Plot detection probability curve
plot(results$theta, results$probability, type = "l",
xlab = "True HR", ylab = "P(detect)")
 # }
# }