Exploratory subgroup identification with forestsearch (the 2024 workflow)
German Breast Cancer Study Group (GBSG) Analysis
Larry F. León
2026-10-30
Source:vignettes/articles/forestsearch-2024.Rmd
forestsearch-2024.RmdAbout this article (added October 2026). This is the package’s original vignette, written for forestsearch as described in León, Jemielita, Guo, Marceau West and Anderson (2024), Statistics in Medicine, https://doi.org/10.1002/sim.10163. It is kept as a reference for that publication: the full argument listing, the bootstrap bias correction and the cross-validation workflow it documents are still available in the package. The current methodology — the search as closed-form stability selection with its declaration calibration (León and Anderson 2026b, arXiv:2610.28379) and the selection-adjusted inference reported with
mr_inference = TRUE(León and Anderson 2026a, arXiv:2609.38361) — is documented invignette("forestsearch")and the post-selection article. The code below runs as written; its settings are those of the 2024 workflow and may differ from the current defaults and from the manuscript analyses.
Introduction
This vignette demonstrates the ForestSearch methodology for exploratory subgroup identification in survival analysis, as described in León et al. (2024) Statistics in Medicine.
Motivation
In clinical trials, particularly oncology, subgroup analyses are essential for:
- Evaluating treatment effect consistency across patient populations
- Identifying subgroups where treatment may be detrimental (harm)
- Characterizing subgroups with enhanced benefit
- Informing regulatory decisions and clinical practice
While prespecified subgroups provide stronger evidence, important subgroups based on patient characteristics may not be anticipated. ForestSearch provides a principled approach to exploratory subgroup identification with proper statistical inference.
Methodology Overview
ForestSearch identifies subgroups through:
- Candidate factor selection: Using LASSO and/or Generalized Random Forests (GRF)
-
Exhaustive subgroup search: Evaluating all
combinations up to
maxkfactors - Consistency-based selection: Applying splitting consistency criteria
- Bootstrap bias correction: Adjusting for selection-induced optimism
- Cross-validation: Assessing algorithm stability
The key innovation is the splitting consistency criterion: a subgroup is considered “consistent with harm” if, when randomly split 50/50 many times, both halves consistently show hazard ratios ≥ 1.0 (for example if 1.0 represents a meaningful “harm threshold”).
Setup
Load Required Packages
library(forestsearch)
library(survival)
library(data.table)
library(ggplot2)
library(gt)
library(grf)
library(policytree)
library(doFuture)

# Optional packages for enhanced output
library(patchwork)
library(weightedsurv)

# Set ggplot theme
theme_set(theme_minimal(base_size = 12))
Data: German Breast Cancer Study Group Trial
Study Background
The GBSG trial evaluated hormonal treatment (tamoxifen) versus no hormonal therapy in node-positive breast cancer patients. Key characteristics:
- Sample size: N = 686
- Outcome: Recurrence-free survival time
- Censoring rate: ~56%
- Treatment: Hormonal therapy (tamoxifen) vs. no hormonal therapy
Data Preparation
# Load GBSG data (from the survival package)
df.analysis <- gbsg

# Prepare analysis variables
df.analysis <- within(df.analysis, {
  id <- seq_len(nrow(df.analysis))
  time_months <- rfstime / 30.4375
  grade3 <- ifelse(grade == "3", 1, 0)
  treat <- hormon
})

# Define variable roles
confounders.name <- c("age", "meno", "size", "grade3", "nodes", "pgr", "er")
outcome.name <- "time_months"
event.name <- "status"
id.name <- "id"
treat.name <- "hormon"

# Display data structure
cat("Sample size:", nrow(df.analysis), "\n")
## Sample size: 686
cat("Events:", sum(df.analysis[[event.name]]),
    sprintf("(%.1f%%)\n", 100 * mean(df.analysis[[event.name]])))
## Events: 299 (43.6%)## Baseline factors: age, meno, size, grade3, nodes, pgr, erBaseline Characteristics
create_summary_table(
  data                  = df.analysis,                                       # required
  treat_var             = treat.name,                                        # default "treat"
  vars_continuous       = c("age", "nodes", "size", "er", "pgr"),            # default NULL
  vars_categorical      = c("grade", "meno"),                                # default NULL
  vars_binary           = NULL,                                              # default NULL
  var_labels            = NULL,                                              # default NULL
  digits                = 1,                                                 # default 1
  show_pvalue           = TRUE,                                              # default TRUE
  show_smd              = TRUE,                                              # default TRUE
  show_missing          = TRUE,                                              # default TRUE
  table_title           = "GBSG Baseline Characteristics by Treatment Arm",  # default "Baseline Characteristics by Treatment Arm"
  table_subtitle        = NULL,                                              # default NULL
  source_note           = NULL,                                              # default NULL
  font_size             = 12,                                                # default 12
  header_font_size      = 14,                                                # default 14
  footnote_font_size    = 10,                                                # default 10
  use_alternating_rows  = TRUE,                                              # default TRUE
  stripe_color          = "#f9f9f9",                                         # default "#f9f9f9"
  indent_size           = 20,                                                # default 20
  highlight_pval        = 0.05,                                              # default 0.05
  highlight_smd         = 0.2,                                               # default 0.2
  highlight_color       = "#fff3cd",                                         # default "#fff3cd"
  compact_mode          = FALSE,                                             # default FALSE
  column_width_var      = 200,                                               # default 200
  column_width_stats    = 120,                                               # default 120
  show_column_borders   = FALSE                                              # default FALSE
)| GBSG Baseline Characteristics by Treatment Arm | |||||
| Characteristic | Control (n=440) | Treatment (n=246) | P-value1 | SMD2 | |
|---|---|---|---|---|---|
| age | Mean (SD) | 51.1 (10.0) | 56.6 (9.4) | <0.001 | 0.57 |
| nodes | Mean (SD) | 4.9 (5.6) | 5.1 (5.3) | 0.665 | 0.03 |
| size | Mean (SD) | 29.6 (14.4) | 28.8 (14.1) | 0.470 | 0.06 |
| er | Mean (SD) | 79.7 (124.2) | 125.8 (191.1) | <0.001 | 0.30 |
| pgr | Mean (SD) | 102.0 (170.0) | 124.3 (249.7) | 0.213 | 0.11 |
| grade | 0.273 | 0.06 | |||
| 1 | 48 (10.9%) | 33 (13.4%) | |||
| 2 | 281 (63.9%) | 163 (66.3%) | |||
| 3 | 111 (25.2%) | 50 (20.3%) | |||
| meno | 209 (47.5%) | 187 (76.0%) | <0.001 | 0.61 | |
| 1 P-values: t-test for continuous, chi-square/Fisher's exact for categorical/binary variables | |||||
| 2 SMD = Standardized mean difference (Cohen's d for continuous, Cramer's V for categorical) | |||||
Kaplan-Meier Analysis (ITT Population)
# Prepare counting process data for KM plot
dfcount <- df_counting(
  df = df.analysis,
  by.risk = 6,
  tte.name = outcome.name,
  event.name = event.name,
  treat.name = treat.name
)

# Plot with confidence intervals and log-rank test
plot_weighted_km(
  dfcount,
  conf.int = TRUE,
  show.logrank = TRUE,
  ymax = 1.05,
  xmed.fraction = 0.775,
  ymed.offset = 0.125
)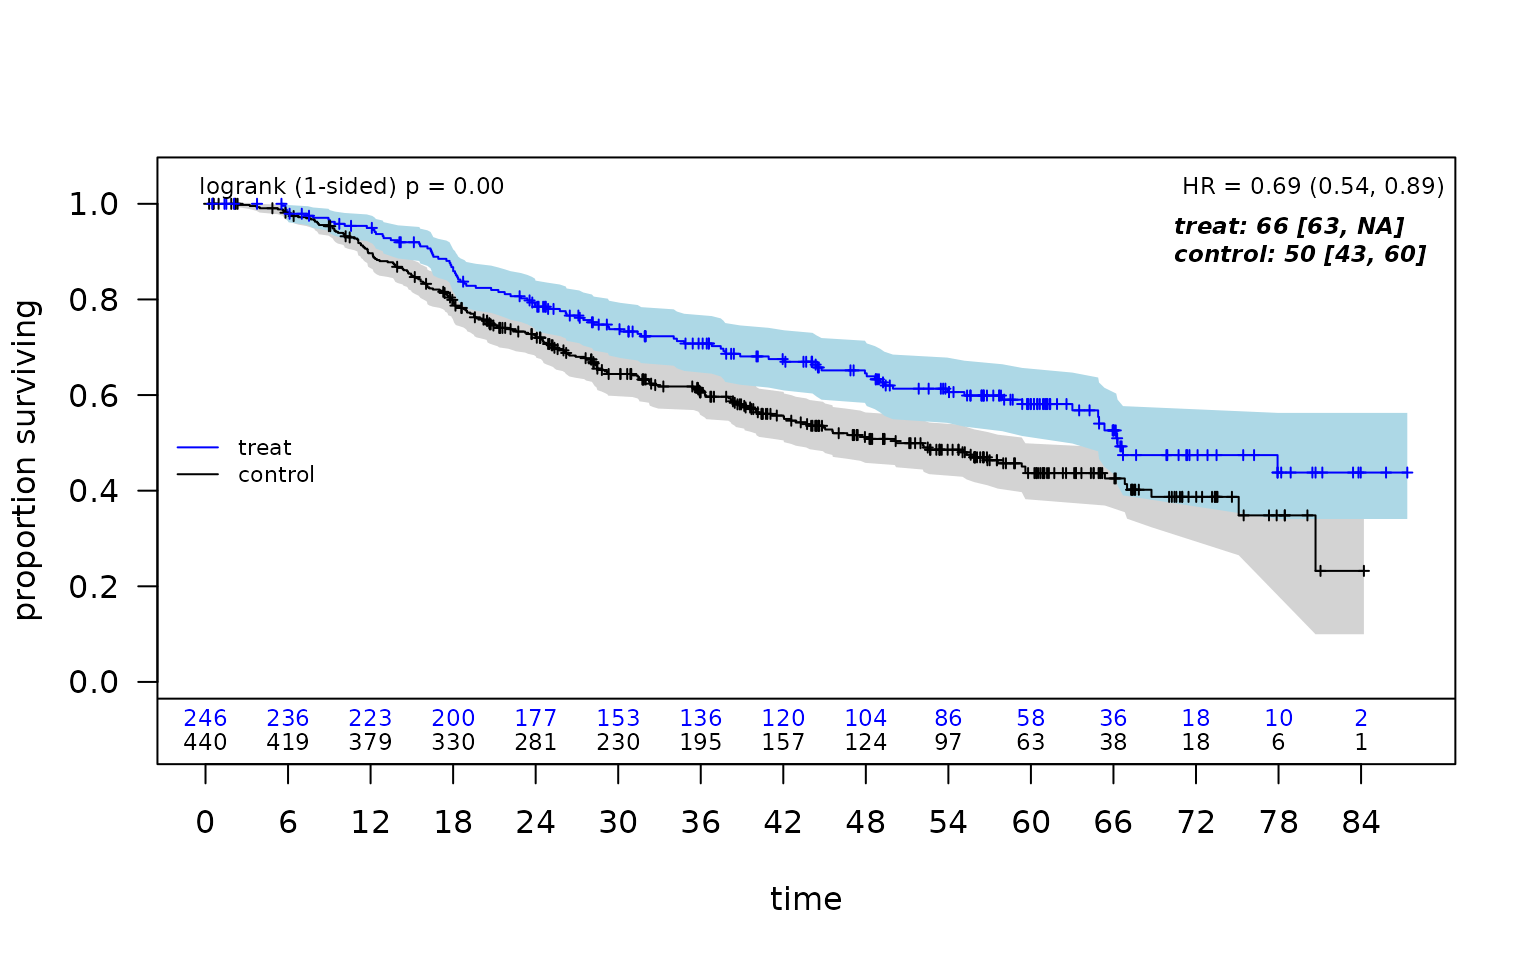
The ITT Cox hazard ratio estimate is approximately 0.69 (95% CI: 0.54, 0.89), suggesting an overall benefit for hormonal therapy.
Preliminary Analysis: Generalized Random Forests
Before running ForestSearch, we can use GRF to explore potential treatment effect heterogeneity and identify candidate factors.
t0 <- proc.time()

# All grf.subg.harm.survival() parameters shown with their default values.
# Required: data, confounders.name, outcome.name, event.name, id.name, treat.name.
grf_est <- grf.subg.harm.survival(
  data                      = df.analysis,         # required
  confounders.name          = confounders.name,    # required
  outcome.name              = outcome.name,        # required
  event.name                = event.name,          # required
  id.name                   = id.name,             # required
  treat.name                = treat.name,          # required
  frac.tau                  = 0.6,                 # default 1.0; max follow-up fraction
  n.min                     = 60,                  # default 60; min subgroup size
  dmin.grf                  = 12,                  # default 0.0; min RMST diff (months)
  RCT                       = TRUE,                # default TRUE
  details                   = TRUE,                # default FALSE
  sg.criterion              = "mDiff",             # default "mDiff"; or "Nsg"
  maxdepth                  = 2,                   # default 2; max policy tree depth (<=3)
  seedit                    = 8316951,             # default 8316951
  return_selected_cuts_only = FALSE,               # default FALSE
  tune_grf                  = FALSE                # default FALSE; CV hyperparameter tuning
)
## tau, maxdepth = 46.75811 2
## leaf.node control.mean control.size control.se depth
## 1 2 6.49 82.00 3.34 1
## 2 3 -4.10 604.00 1.06 1
## 11 4 -7.90 112.00 2.81 2
## 21 5 3.86 177.00 1.87 2
## 4 7 -5.89 356.00 1.33 2
##
## Selected subgroup:
## leaf.node control.mean control.size control.se depth
## 1 2 6.49 82.00 3.34 1
##
## GRF subgroup found
## Terminating node at max.diff (sg.harm.id):
## [1] "er <= 0"
##
## All splits (from all trees):
## [1] "er <= 0" "age <= 50" "age <= 43"
timings$grf <- (proc.time() - t0)["elapsed"]
# Display policy trees
# leaf1 = recommend control, leaf2 = recommend treatment
par(mfrow = c(1, 2))
plot(grf_est$tree1, leaf.labels = c("Control", "Treat"), main = "Depth 1")GRF identifies estrogen receptor status (ER) as a key factor, with ER ≤ 0 suggesting potential harm from hormonal therapy.
ForestSearch Analysis
Parallel Processing Configuration
ForestSearch supports parallel processing for computationally intensive operations (bootstrap, cross-validation).
# Detect available cores (limited to 2 cores for CRAN checks)
n_cores <- 2
n_cores_total <- parallel::detectCores()
cat("Using", n_cores, "of", n_cores_total, "total cores for parallel processing")
## Using 2 of 4 total cores for parallel processingRunning ForestSearch
ForestSearch performs an exhaustive search over candidate subgroup
combinations with up to maxk factors. Key parameters:
| Parameter | Value | Description |
|---|---|---|
hr.threshold |
1.25 | Minimum HR for consistency evaluation |
hr.consistency |
1.0 | Minimum consistency rate for candidates |
pconsistency.threshold |
0.90 | Required consistency for selection |
maxk |
2 | Maximum factors in subgroup definition |
n.min |
60 | Minimum subgroup sample size |
d0.min, d1.min
|
12 | Minimum events per treatment arm |
t0 <- proc.time()

# All forestsearch() parameters shown with their default values.
# Comments indicate the package default; the value used here may differ.
fs <- forestsearch(
  df.analysis                = df.analysis,                  # required

  # ─── Variable names ─────────────────────────────────────────────────────
  outcome.name               = outcome.name,                 # default "tte"
  event.name                 = event.name,                   # default "event"
  treat.name                 = treat.name,                   # default "treat"
  id.name                    = id.name,                      # default "id"
  potentialOutcome.name      = NULL,                         # default NULL
  flag_harm.name             = NULL,                         # default NULL
  confounders.name           = confounders.name,             # default NULL

  # ─── Parallel processing ────────────────────────────────────────────────
  parallel_args              = list(plan = "multisession",
                                    workers = n_cores,
                                    show_message = TRUE),    # default plan="multisession"

  # ─── Prediction / RCT flag ──────────────────────────────────────────────
  df.predict                 = NULL,                         # default NULL
  df.test                    = NULL,                         # default NULL
  is.RCT                     = TRUE,                         # default TRUE
  seedit                     = 8316951,                      # default 8316951
  est.scale                  = "hr",                         # default "hr"

  # ─── Factor selection: LASSO + GRF ──────────────────────────────────────
  use_lasso                  = TRUE,                         # default TRUE
  use_grf                    = TRUE,                         # default TRUE
  grf_res                    = NULL,                         # default NULL; pass cached GRF result
  grf_cuts                   = NULL,                         # default NULL
  grf_depth                  = 2,                            # default 2
  dmin.grf                   = 0.0,                          # default 0.0
  frac.tau                   = 0.8,                          # default 0.8
  return_selected_cuts_only  = TRUE,                         # default TRUE
  tune_grf                   = FALSE,                        # default FALSE

  # ─── Cuts / discretization ──────────────────────────────────────────────
  conf_force                 = NULL,                         # default NULL
  defaultcut_names           = NULL,                         # default NULL
  cut_type                   = "default",                    # default "default"
  exclude_cuts               = NULL,                         # default NULL
  replace_med_grf            = FALSE,                        # default FALSE
  cont.cutoff                = 4,                            # default 4
  conf.cont_medians          = NULL,                         # default NULL
  conf.cont_medians_force    = NULL,                         # default NULL
  conf.cont_jcuts            = NULL,                         # default NULL

  # ─── Subgroup constraints ───────────────────────────────────────────────
  n.min                      = 60,                           # default 60; min subgroup size
  d0.min                     = 12,                           # default 10; min events arm 0
  d1.min                     = 12,                           # default 10; min events arm 1
  maxk                       = 2,                            # default 2; max factors per SG
  max_subgroups_search       = 3,                            # default 10

  # ─── Thresholds (preferred names take precedence if both supplied) ─────
  effect.threshold           = NULL,                         # default NULL; alias for hr.threshold
  consistency.threshold      = NULL,                         # default NULL; alias for hr.consistency
  hr.threshold               = 1.25,                         # default 1.25; screening threshold
  hr.consistency             = 1.0,                          # default 1.0; consistency threshold

  # ─── Selection (sg_focus / Pareto neighborhood) ─────────────────────────
  sg_focus                   = "maxSG",                    # default "hr"; "hr"/"eff", "maxSG", "minSG", "hrMaxSG"/"effMaxSG", "hrMinSG"/"effMinSG"
  selection_rule             = "neighborhood",               # default "neighborhood"; or "pareto", "both" (only for hrMaxSG/hrMinSG)
  effect_neighborhood        = 0.10,                         # default 0.10; tol for hrMaxSG/hrMinSG

  # ─── Consistency evaluation ─────────────────────────────────────────────
  fs.splits                  = 100,                          # default 1000; split-half repeats
  m1.threshold               = Inf,                          # default Inf
  pconsistency.threshold     = 0.80,                         # default 0.90
  stop_threshold             = 0.80,                         # default 0.95; early-stop consistency

  # ─── Two-stage consistency ──────────────────────────────────────────────
  use_twostage               = TRUE,                         # default TRUE
  twostage_args              = list(),                       # default list()

  # ─── GLM outcome support (survival analysis here) ───────────────────────
  outcome_type               = "survival",                   # default "survival"; or "binary", "continuous", "count"
  effect_measure             = NULL,                         # default NULL; auto-set from outcome_type
  offset.name                = NULL,                         # default NULL; required for count
  adverse_outcome            = NULL,                         # default NULL; auto-set
  overdispersion             = "none",                       # default "none"; or "quasi", "negbin"
  grf_count_transform        = "log",                        # default "log"; or "identity"

  # ─── Propensity-score adjustment (observational analyses) ───────────────
  ps_method                  = NULL,                         # default NULL
  ps_adjust_method           = "none",                       # default "none"; or "iptw", "dr_gcomp"
  ps_hat                     = NULL,                         # default NULL

  # ─── Output / diagnostics ───────────────────────────────────────────────
  show_candidate_summary     = TRUE,                         # default FALSE; pre-/post-consistency previews
  minp                       = 0.025,                        # default 0.025
  details                    = TRUE,                         # default FALSE
  quiet                      = FALSE,                        # default FALSE
  by.risk                    = 12,                           # default 12
  plot.sg                    = TRUE,                         # default FALSE; KM plots for SG
  plot.grf                   = FALSE                         # default FALSE
)
## GRF subgroup: er <= 0
## GRF cuts identified: 1
## Cuts: er <= 0
## Cox-LASSO selected: 4 of 7 candidate factors
## Omitted: age, meno, er
## Candidate factors: 14
## [1] "er <= 0" "size <= 29" "size <= 25" "size <= 20" "size <= 35"
## [6] "nodes <= 5" "nodes <= 3" "nodes <= 1" "nodes <= 7" "pgr <= 110"
## [11] "pgr <= 33" "pgr <= 7" "pgr <= 132" "grade3"
## Number of possible configurations (<= maxk): maxk = 2 , # combinations = 406
## Per-arm events criteria: control >= 12, treatment >= 12
## Sample size criteria: n >= 60
## Subgroup search completed in 0.01 minutes
##
## --- Filtering Summary ---
## Combinations evaluated: 406
## Passed variance check: 374
## Passed prevalence (>= 0.025 ): 374
## Passed redundancy check: 354
## Passed events counts (d0>= 12, d1>= 12): 250
## Passed sample size (n>= 60 ): 247
## Cox model fit successfully: 247
## Passed effect threshold (effect >= 1.2500): 7
## -------------------------
##
## Found 7 subgroup candidate(s)
## # of candidate subgroups (meeting all criteria) = 7
## # of unique initial candidates: 7## # Restricting to top stop_Kgroups = 3
## # of candidates to evaluate: 3
##
## ==============================================================================================================
## CANDIDATE EVALUATION PREVIEW (pre-consistency) (sg_focus = "maxSG", selection_rule = "neighborhood")
## ==============================================================================================================
## Rank HR N E K OF Subgroup
## --------------------------------------------------------------------------------------------------------------
## 1 1.951 82 45 1 * {er <= 0}
## 2 2.222 75 41 2 * {er <= 0} & {pgr <= 33}
## 3 1.710 72 39 2 - {pgr <= 7} & {grade3}
## --------------------------------------------------------------------------------------------------------------
## To evaluate: 3 On frontier: 2
## Legend: OF = on Pareto frontier.
## ==============================================================================================================## Parallel config: workers = 2 , batch_size = 3
## Batch 1 / 1 : candidates 1 - 3
## Evaluated 3 of 3 candidates (complete)
## 3 subgroups passed consistency threshold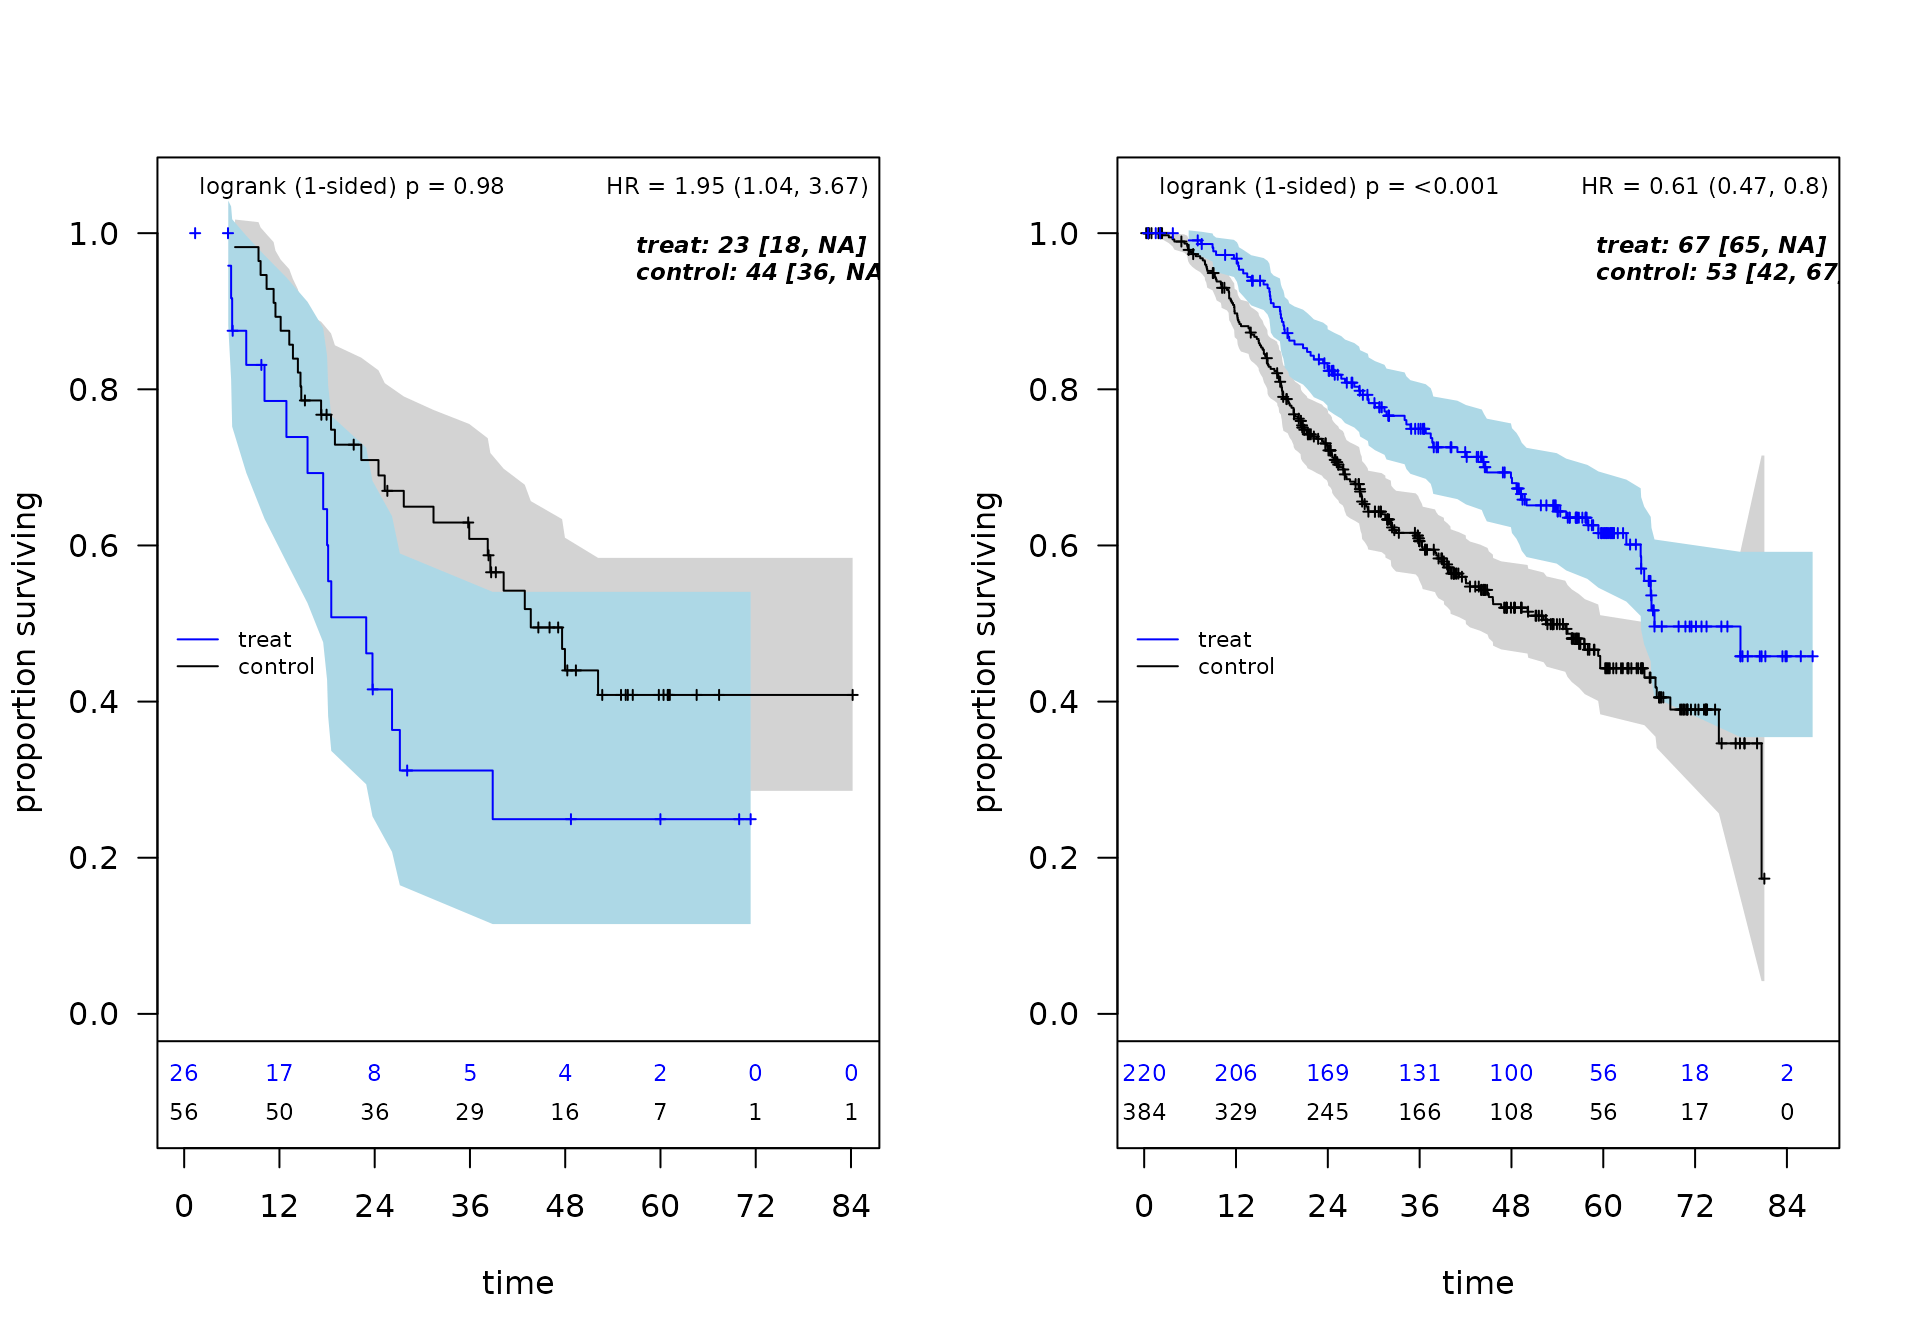
## *** Subgroup found: {er <= 0}
## % consistency criteria met= 0.96
## SG focus = maxSG
##
## ==============================================================================================================
## CANDIDATE EVALUATION SUMMARY  (sg_focus = "maxSG", selection_rule = "neighborhood")
## ==============================================================================================================
## Rank  HR      N      E     K    P      OF  S  Subgroup
## --------------------------------------------------------------------------------------------------------------
##    1   1.951     82    45    1  0.960  *   *  {er <= 0}
##    2   2.222     75    41    2  0.990  *   -  {er <= 0} & {pgr <= 33}
##    3   1.710     72    39    2  0.860  -   -  {pgr <= 7} & {grade3}
## --------------------------------------------------------------------------------------------------------------
## Evaluated: 3   Passed: 3   On frontier: 2   Selected: m=1
## Legend: P = Pcons (consistency probability); OF = on Pareto frontier; S = selected.
## ==============================================================================================================
##
## Seconds and minutes forestsearch overall = 5.293 0.0882
## Consistency algorithm used: twostage
## Subgroup identified: {er <= 0}
plan("sequential")
timings$forestsearch <- (proc.time() - t0)["elapsed"]

cat("\nForestSearch completed in",
    round(timings$forestsearch, 1), "seconds\n")
##
## ForestSearch completed in 5.3 secondsForestSearch Results
Identified Subgroups
# Generate results tables
# All sg_tables() parameters shown with their default values.
res_tabs <- sg_tables(
  fs                    = fs,                                # required
  which_df              = "est",                             # default "est"
  est_title             = "Treatment Effect Estimates",      # default "Treatment Effect Estimates"
  est_caption           = "Training data estimates",         # default "Training data estimates"
  sg_title              = "Identified Subgroups",            # default "Identified Subgroups"
  sg_subtitle           = NULL,                              # default NULL
  potentialOutcome.name = NULL,                              # default NULL
  hr_1a                 = NA,                                # default NA
  hr_0a                 = NA,                                # default NA
  ndecimals             = 3,                                 # default 3
  include_search_info   = TRUE,                              # default TRUE
  subgroup_notation     = NULL,                              # default NULL; or "harm", "benefit"
  font_size             = 12                                 # default 12
)

# Display top subgroups meeting criteria
res_tabs$sg10_out| Identified Subgroups | ||||||
| Two-factor subgroups (maxk=2) | ||||||
| Factor 1 | Factor 2 | N | Events | E1 | HR | Pcons |
|---|---|---|---|---|---|---|
| {er <= 0} | 82 | 45 | 16 | 1.951 | 0.960 | |
| {er <= 0} | {pgr <= 33} | 75 | 41 | 16 | 2.222 | 0.990 |
| {pgr <= 7} | {grade3} | 72 | 39 | 13 | 1.710 | 0.860 |
| Search Configuration: Single-factor candidates (L) = 28; Maximum combinations evaluated = 406; Search depth (maxk) = 2 | ||||||
| Search Results: Candidate subgroups found = 7; Maximum HR estimate = 2.54 | ||||||
| Note: E1 = events in treatment arm; Pcons = consistency proportion | ||||||
Treatment Effect Estimates
# ITT and subgroup estimates
res_tabs$tab_estimates| Treatment Effect Estimates | |||||||
| Training data estimates | |||||||
| Subgroup | n | n1 | events | m1 | m0 | RMST | HR (95% CI) |
|---|---|---|---|---|---|---|---|
| ITT | 686 (100.0%) | 246 (35.9%) | 299 (43.6%) | 66.3 | 50.2 | 7.8 | 0.69 (0.54, 0.89) |
| Questionable1 | 82 (12.0%) | 26 (31.7%) | 45 (54.9%) | 22.9 | 43.7 | -14 | 1.95 (1.04, 3.67) |
| Recommend | 604 (88.0%) | 220 (36.4%) | 254 (42.1%) | 66.7 | 52.6 | 9.3 | 0.61 (0.47, 0.80) |
| 1 Identified subgroup: {er <= 0} | |||||||
Identified Subgroup Definition
## Identified subgroup (H): {er <= 0}
cat("Subgroup size:", sum(fs$df.est$treat.recommend == 0),
    sprintf("(%.1f%% of ITT)\n",
            100 * mean(fs$df.est$treat.recommend == 0)))
## Subgroup size: 82 (12.0% of ITT)ForestSearch identifies Estrogen ≤ 0 (ER-negative) as the subgroup with potential harm. This is biologically plausible: tamoxifen is a selective estrogen receptor modulator with limited efficacy in ER-negative tumors.
Bootstrap Bias Correction
Rationale
Cox model estimates from identified subgroups are upwardly biased due to the selection process (subgroups are selected because they show extreme effects). Bootstrap bias correction addresses this by:
- Resampling with replacement
- Re-running the entire ForestSearch algorithm
- Computing bias terms from bootstrap vs. observed estimates
- Applying infinitesimal jackknife variance estimation
Running Bootstrap Analysis
# Number of bootstrap iterations
# Use 500-2000 for production; reduced here for vignette
NB <- 2

t0 <- proc.time()

# All forestsearch_bootstrap_dofuture() parameters shown with their defaults.
fs_bc <- forestsearch_bootstrap_dofuture(
  fs.est        = fs,                                        # required
  nb_boots      = NB,                                        # required (use 500-2000 for production)
  seed          = 8316951L,                                  # default 8316951L
  details       = FALSE,                                     # default FALSE
  show_three    = FALSE,                                     # default FALSE
  parallel_args = list(plan = "multisession",
                       workers = n_cores,
                       show_message = TRUE),                 # default list()
  digits        = 4                                          # default 4
)

plan("sequential")
timings$bootstrap <- (proc.time() - t0)["elapsed"]

cat("\nBootstrap completed in",
    round(timings$bootstrap / 60, 1), "minutes\n")
##
## Bootstrap completed in 0.2 minutesBootstrap Summary and Diagnostics
# All summarize_bootstrap_results() parameters shown with their defaults.
summaries <- summarize_bootstrap_results(
  sgharm       = fs$sg.harm,                                 # required
  boot_results = fs_bc,                                      # required
  create_plots = TRUE,                                       # default FALSE
  est.scale    = "hr",                                       # default "hr"
  digits       = 2                                           # default 2
)
##
## ===============================================================
## BOOTSTRAP ANALYSIS SUMMARY
## ===============================================================
##
## IDENTIFIED SUBGROUP:
## -------------------------------------------------------------
## H: {er <= 0}
##
## BOOTSTRAP SUCCESS METRICS:
## -------------------------------------------------------------
## Total iterations: 2
## Successful subgroup ID: 2 (100.0%)
## Failed to find subgroup: 0 (0.0%)
##
## TIMING ANALYSIS:
## -------------------------------------------------------------
## Overall:
## Total bootstrap time: 0.15 minutes (0.00 hours)
## Average per iteration: 0.08 min (4.6 sec)
## Projected for 1000 boots: 75.93 min (1.27 hrs)
# Display bias-corrected estimates table
summaries$table| Treatment Effect by Subgroup | ||||||||
| Bootstrap bias-corrected estimates (2 iterations) | ||||||||
| Subgroup |
Sample Size
|
Survival
|
Treatment Effect
|
|||||
|---|---|---|---|---|---|---|---|---|
| N | NT | Events | MedT | MedC | RMSTd |
HR (95% CI)†1 |
HR‡ (95% CI)2 |
|
| Qstnbl3 | 82 (12.0%) | 26 (31.7%) | 45 (54.9%) | 22.9 | 43.7 | -14 | 1.95 (1.04, 3.67) | 3.0206 (1e-04,148775.2913) |
| Recmnd | 604 (88.0%) | 220 (36.4%) | 254 (42.1%) | 66.7 | 52.6 | 9.3 | 0.61 (0.47, 0.80) | 0.75 (0.19,2.86) |
| 1 Unadjusted HR: Standard Cox regression hazard ratio with robust standard errors | ||||||||
| 2 Bias-corrected HR: Bootstrap-adjusted estimate using infinitesimal jackknife method (2 iterations). Corrects for optimism in subgroup selection. | ||||||||
| 3 Identified subgroup: {er <= 0} | ||||||||
| Note: Med = Median survival time (months). RMSTd = Restricted mean survival time difference. Subgroup identified in 100.0% of bootstrap samples. | ||||||||
Kaplan-Meier by Identified Subgroups
# All plot_sg_weighted_km() parameters shown with their defaults.
km_result <- plot_sg_weighted_km(
  fs.est         = fs,                                       # required
  fs_bc          = fs_bc,                                    # default NULL
  outcome.name   = "time_months",                            # default "Y"
  event.name     = "status",                                 # default "Event"
  treat.name     = "hormon",                                 # default "Treat"
  by.risk        = 12,                                       # default NULL
  sg0_name       = NULL,                                     # default NULL
  sg1_name       = NULL,                                     # default NULL
  conf.int       = TRUE,                                     # default TRUE
  show.logrank   = FALSE,                                    # default TRUE
  show.cox       = FALSE,                                    # default TRUE
  show.cox.bc    = TRUE,                                     # default TRUE
  put.legend.lr  = "topleft",                                # default "topleft"
  ymax           = 1.05,                                     # default 1.05
  xmed.fraction  = 0.65,                                     # default 0.65
  hr_bc_position = "topright",                               # default "bottomright"
  hr_bc_cex      = 0.725,                                    # default 0.725
  title          = NULL,                                     # default NULL
  verbose        = FALSE                                     # default FALSE
)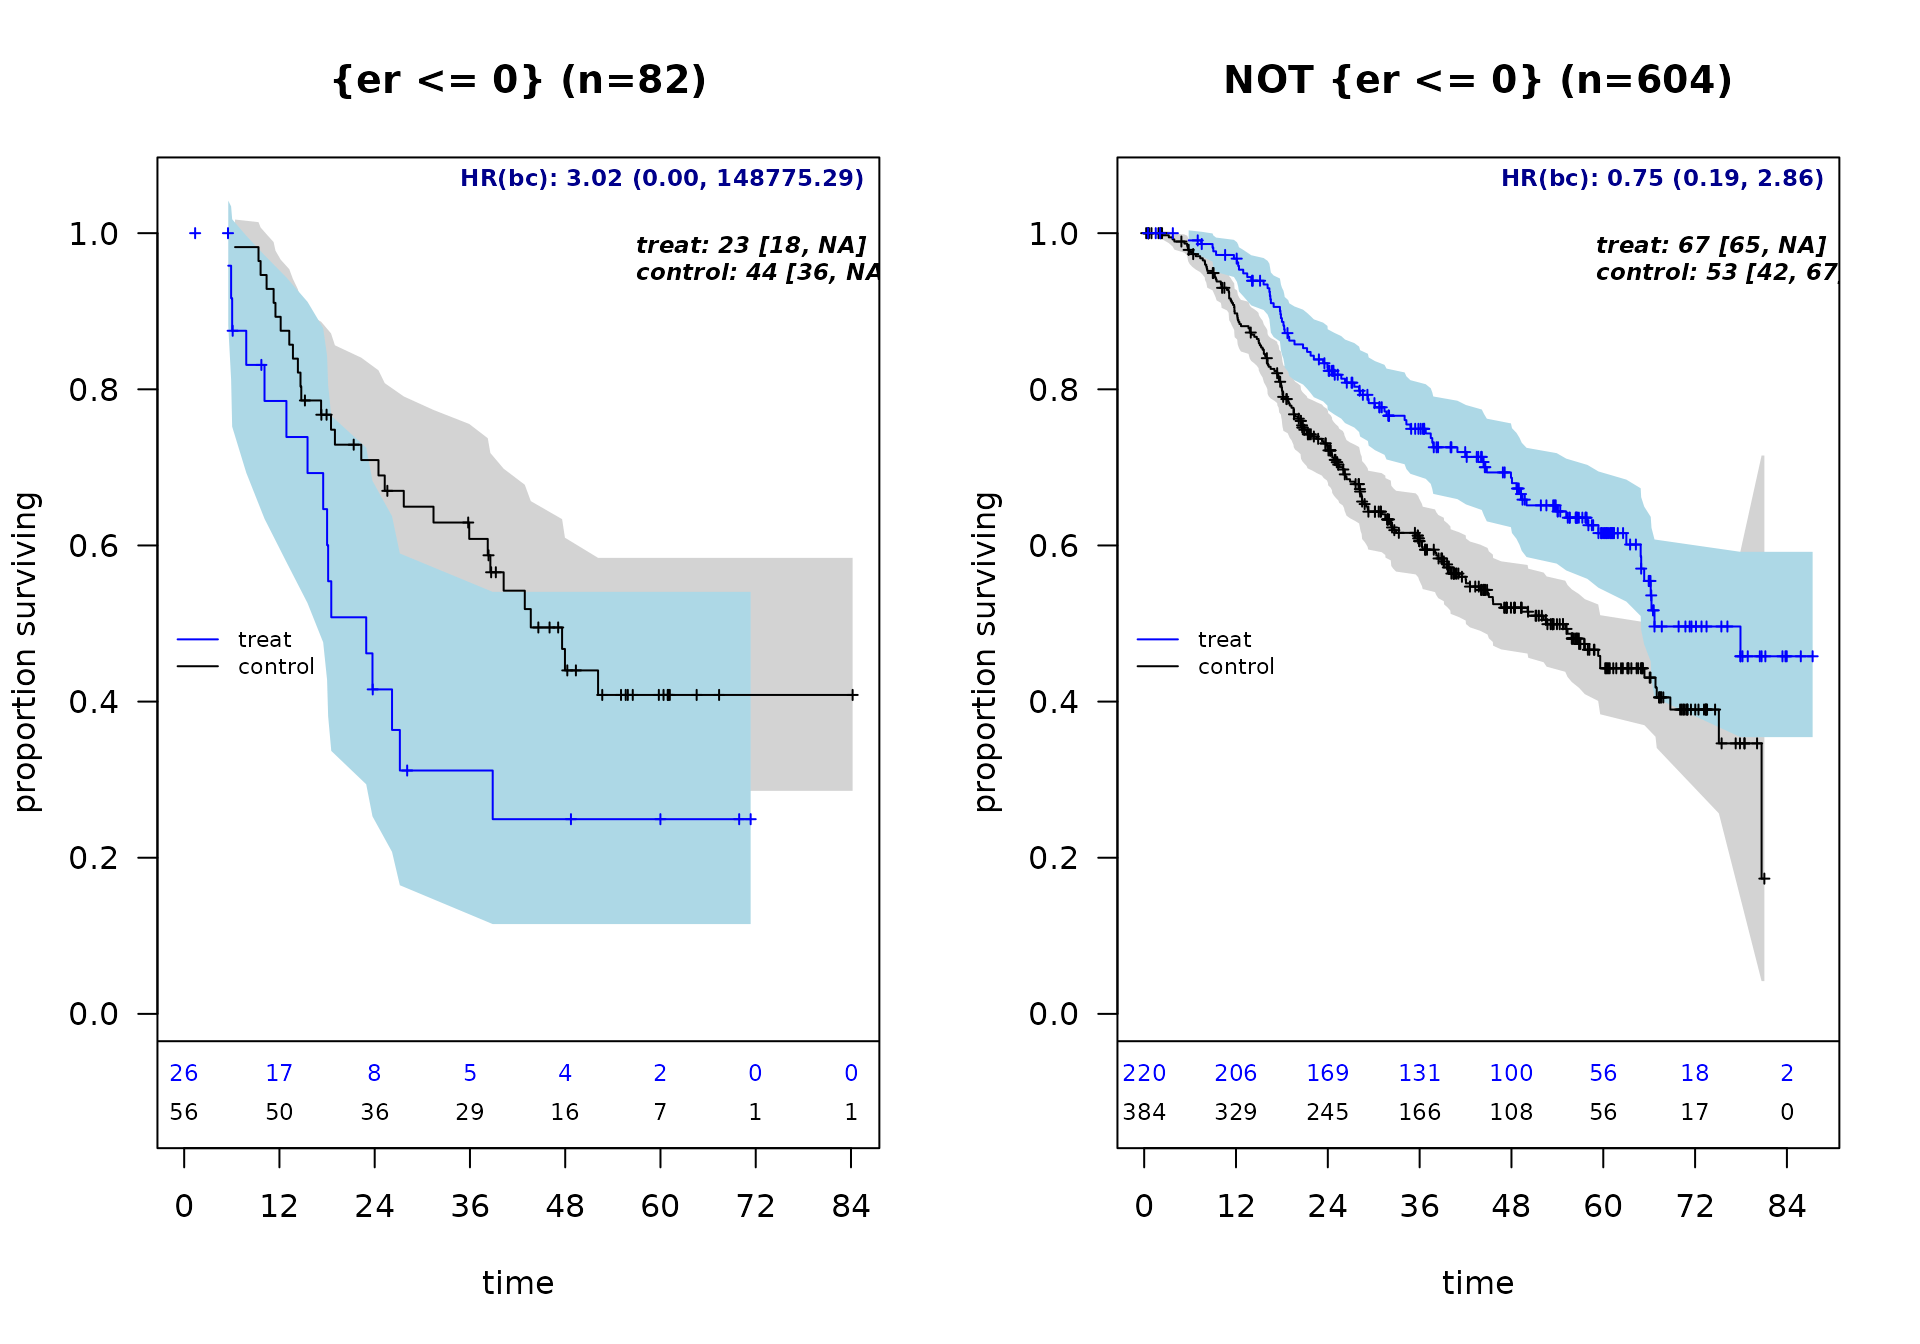
Kaplan-Meier survival curves by identified subgroup
Note: Identified subgroup: {er <= 0}. HR(bc) = bootstrap bias-corrected hazard ratio. Medians [95% CI] for arms are un-adjusted.
Event Count Summary
Low event counts can lead to unstable HR estimates. This summary helps identify potential issues:
# note that default required minimum events is 12 for subgroup candidate
# Here we evaluate frequency of subgroup candidates in bootstrap samples less than 15
# All summarize_bootstrap_events() parameters shown with their defaults.
event_summary <- summarize_bootstrap_events(
  boot_results = fs_bc,                                      # required
  threshold    = 15                                          # default 5
)
##
## === Bootstrap Event Count Summary ===
## Total bootstrap iterations: 2
## Event threshold: <15 events
##
## ORIGINAL Subgroup H on BOOTSTRAP samples:
## Control arm <15 events: 0 (0.0%)
## Treatment arm <15 events: 0 (0.0%)
## Either arm <15 events: 0 (0.0%)
##
## ORIGINAL Subgroup Hc on BOOTSTRAP samples:
## Control arm <15 events: 0 (0.0%)
## Treatment arm <15 events: 0 (0.0%)
## Either arm <15 events: 0 (0.0%)
##
## NEW Subgroups found: 2 (100.0%)
##
## NEW Subgroup H* on ORIGINAL data:
## Control arm <15 events: 0 (0.0% of successful)
## Treatment arm <15 events: 0 (0.0% of successful)
## Either arm <15 events: 0 (0.0% of successful)
##
## NEW Subgroup Hc* on ORIGINAL data:
## Control arm <15 events: 0 (0.0% of successful)
## Treatment arm <15 events: 0 (0.0% of successful)
## Either arm <15 events: 0 (0.0% of successful)Bootstrap Diagnostics
# Quality metrics
summaries$diagnostics_table_gt| Bootstrap Diagnostics Summary | ||
| Analysis of 2 bootstrap iterations | ||
| Category | Metric | Value |
|---|---|---|
| Success Rate | Total iterations | 2 |
| Successful | 2 (100.0%) | |
| Failed | 0 (0.0%) | |
| Success rating | Excellent | |
| Subgroup H (Questionable) | Observed HR | 1.951 |
| Bias-corrected HR | 3.021 | |
| Bootstrap CV (%) | 38.5% | |
| N estimates | 2 | |
| Subgroup Hc (Recommend) | Observed HR | 0.615 |
| Bias-corrected HR | 0.746 | |
| Bootstrap CV (%) | 18.1% | |
| N estimates | 2 | |
Subgroup Agreement
How consistently does bootstrap identify the same subgroup?
# Agreement with original analysis
if (!is.null(summaries$subgroup_summary$original_agreement)) {
  summaries$subgroup_summary$original_agreement
}
## Metric Value
## <char> <char>
## 1: Total bootstrap iterations 2
## 2: Successful iterations 2
## 3: Failed iterations (no subgroup) 0
## 4:
## 5: Original subgroup definition {er <= 0}
## 6: Exact match with original 0 (0.0%)
## 7: Different from original 2 (100.0%)
## 8: Partial match (shared factor) 0 (0.0%)
# Factor presence across bootstrap iterations
if (!is.null(summaries$subgroup_summary$factor_presence)) {
  summaries$subgroup_summary$factor_presence
}
## Rank Factor Count Percent
## 1 1 er 2 100
## 2 2 pgr 1 50
## 3 3 size 1 50Bootstrap Distributions
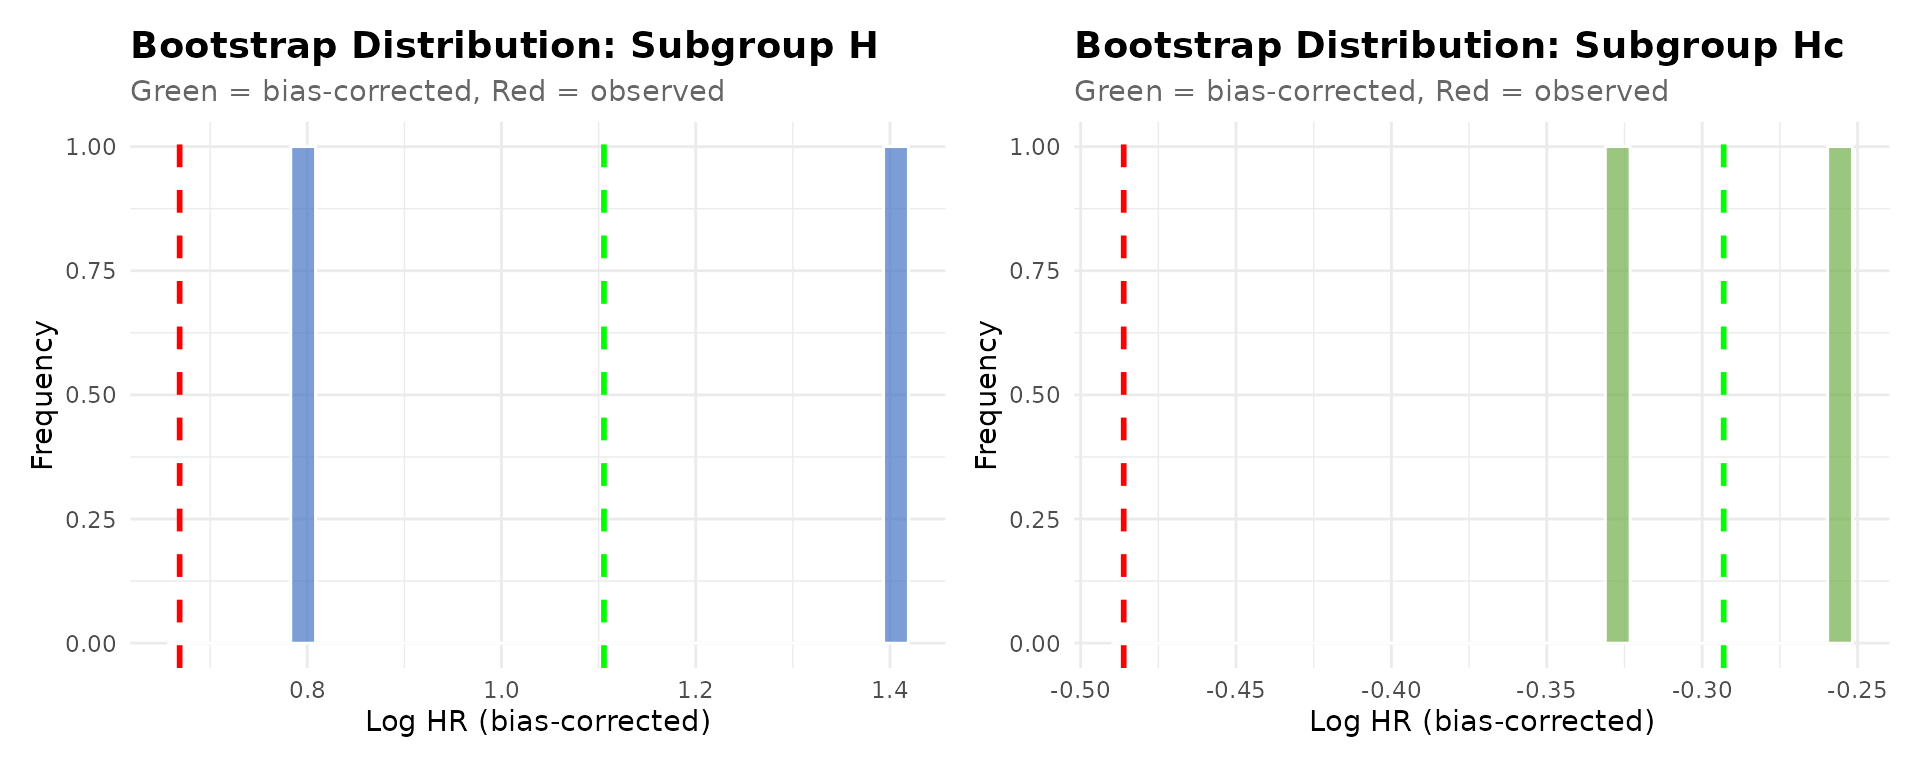
if (!is.null(summaries$plots)) {
  summaries$plots$H_distribution + summaries$plots$Hc_distribution
}
Cross-Validation
Cross-validation assesses the stability of the ForestSearch algorithm. Two approaches are available:
K-Fold Cross-Validation
# 10-fold CV with multiple iterations
# Use Ksims >= 50 for production
Ksims <- 1

t0 <- proc.time()

# All forestsearch_tenfold() parameters shown with their defaults.
fs_kfold <- forestsearch_tenfold(
  fs.est        = fs,                                        # required
  sims          = Ksims,                                     # required (use >=50 for production)
  Kfolds        = 2,                                         # default 10
  details       = FALSE,                                     # default TRUE
  seed          = 8316951L,                                  # default 8316951L
  parallel_args = list(plan = "multisession",
                       workers = n_cores,
                       show_message = FALSE),                # default plan="multisession", workers=6
  keep_resCV    = FALSE                                      # default FALSE
)

plan("sequential")
timings$kfold <- (proc.time() - t0)["elapsed"]

# All cv_metrics_tables() parameters shown with their defaults.
metrics_tables <- cv_metrics_tables(
  cv_result        = fs_kfold,                               # required
  sg_definition    = NULL,                                   # default NULL
  title            = "Cross-Validation Metrics",             # default "Cross-Validation Metrics"
  show_percentages = TRUE,                                   # default TRUE
  digits           = 1,                                      # default 1
  include_raw      = FALSE,                                  # default FALSE
  table_style      = "combined",                             # default "combined"; or "separate", "minimal"
  use_gt           = TRUE                                    # default TRUE
)
metrics_tables| Cross-Validation Metrics | ||
| Subgroup: Identified Subgroup | ||
| Metric | Description | Value (%) |
|---|---|---|
| Agreement | ||
| Sensitivity (H) | Agreement rate for subgroup H | 19.5 |
| Sensitivity (Hc) | Agreement rate for complement Hc | 76.2 |
| PPV (H) | Positive predictive value for H | 10.0 |
| PPV (Hc) | Positive predictive value for Hc | 87.5 |
| Subgroup Finding | ||
| Any Found | Any subgroup identified | 100.0 |
| Exact Match | Exact match on all factors | 0.0 |
| At Least 1 | At least one factor matches | 0.0 |
| Cov1 Any | First covariate found (any cut) | 0.0 |
| Cov2 Any | Second covariate found (any cut) | NA |
| Cov1 & Cov2 | Both covariates found | 0.0 |
| Cov1 Exact | First covariate exact match | 0.0 |
| Cov2 Exact | Second covariate exact match | NA |
| Based on 1 simulation(s) with 2-fold CV. Values are proportions shown as percentages. | ||
Out-of-Bag (N-Fold) Cross-Validation
N-fold CV (leave-one-out):
t0 <- proc.time()

# All forestsearch_Kfold() parameters shown with their defaults.
fs_OOB <- forestsearch_Kfold(
  fs.est        = fs,                                        # required
  Kfolds        = round(nrow(df.analysis)/100, 0),           # default nrow(fs.est$df.est) (LOO)
  seedit        = 8316951L,                                  # default 8316951L
  parallel_args = list(plan = "multisession",
                       workers = n_cores,
                       show_message = TRUE),                 # default plan="multisession", workers=6
  sg0.name      = "Not recommend",                           # default "Not recommend"
  sg1.name      = "Recommend",                               # default "Recommend"
  details       = FALSE                                      # default FALSE
)

plan("sequential")
timings$oob <- (proc.time() - t0)["elapsed"]

# All forestsearch_KfoldOut() parameters shown with their defaults.
cv_out <- forestsearch_KfoldOut(
  res     = fs_OOB,                                          # required
  details = FALSE,                                           # default FALSE
  outall  = TRUE,                                            # default FALSE
  digits  = 4                                                # default 4
)

# All cv_summary_tables() parameters shown with their defaults.
tables <- cv_summary_tables(
  kfold_out    = cv_out,                                     # required
  title        = "Cross-Validation Summary",                 # default "Cross-Validation Summary"
  subtitle     = NULL,                                       # default NULL
  show_metrics = TRUE,                                       # default TRUE
  digits       = 3,                                          # default 3
  font_size    = 12,                                         # default 12
  use_gt       = TRUE                                        # default TRUE
)

tables$combined_table

tables$metrics_table
Results Visualization
Forest Plot
The forest plot summarizes treatment effects across the ITT population, reference subgroups, and identified subgroups with cross-validation metrics.
# Define reference subgroups for comparison
subgroups <- list(
  age_gt65 = list(
    subset_expr = "age > 65",
    name = "Age > 65",
    type = "reference"
  ),
  age_le65 = list(
    subset_expr = "age <= 65",
    name = "Age ≤ 65",
    type = "reference"
  ),
  pgr_positive = list(
    subset_expr = "pgr > 0",
    name = "PgR > 0",
    type = "reference"
  ),
  pgr_negative = list(
    subset_expr = "pgr <= 0",
    name = "PgR ≤ 0",
    type = "reference"
  )
)


# All create_forest_theme() parameters shown with their defaults.
my_theme <- create_forest_theme(
  base_size         = 24,                                    # default 10
  scale             = 1.0,                                   # default 1.0
  row_padding       = NULL,                                  # default NULL
  ci_pch            = 15,                                    # default 15
  ci_lwd            = NULL,                                  # default NULL
  ci_Theight        = NULL,                                  # default NULL
  ci_col            = "black",                               # default "black"
  header_fontsize   = NULL,                                  # default NULL (auto)
  body_fontsize     = NULL,                                  # default NULL (auto)
  footnote_fontsize = 17,                                    # default NULL
  footnote_col      = "darkcyan",                            # default "darkcyan"
  title_fontsize    = NULL,                                  # default NULL
  cv_fontsize       = 22,                                    # default NULL
  cv_col            = "gray30",                              # default "gray30"
  refline_lwd       = NULL,                                  # default NULL
  refline_lty       = "dashed",                              # default "dashed"
  refline_col       = "gray30",                              # default "gray30"
  vertline_lwd      = NULL,                                  # default NULL
  vertline_lty      = "dashed",                              # default "dashed"
  vertline_col      = "gray20",                              # default "gray20"
  arrow_type        = "closed",                              # default "closed"
  arrow_col         = "black",                               # default "black"
  summary_fill      = "black",                               # default "black"
  summary_col       = "black"                                # default "black"
)


# Create forest plot
# Include fs_kfold and fs_OOB if available for CV metrics
# All plot_subgroup_results_forestplot() parameters shown with their defaults.
result <- plot_subgroup_results_forestplot(
  fs_results        = list(fs.est   = fs,
                           fs_bc    = fs_bc,
                           fs_OOB   = NULL,
                           fs_kfold = fs_kfold),             # required
  df_analysis       = df.analysis,                           # required
  subgroup_list     = subgroups,                             # default NULL
  outcome.name      = outcome.name,                          # required
  event.name        = event.name,                            # required
  treat.name        = treat.name,                            # required
  E.name            = "Hormonal",                            # default "Experimental"
  C.name            = "Chemo",                               # default "Control"
  est.scale         = "hr",                                  # default "hr"
  xlog              = TRUE,                                  # default TRUE
  title_text        = NULL,                                  # default NULL
  arrow_text        = c("Favors Experimental", "Favors Control"),  # default same
  footnote_text     = c("Eg 80% of training found SG: 70% of B (+) also B in CV testing"),  # default same
  xlim              = c(0.25, 1.5),                          # default c(0.25, 1.5)
  ticks_at          = c(0.25, 0.70, 1.0, 1.5),               # default c(0.25, 0.70, 1.0, 1.5)
  show_cv_metrics   = TRUE,                                  # default TRUE
  cv_source         = "auto",                                # default "auto"; or "kfold", "oob", "both"
  posthoc_colors    = c("powderblue", "beige"),              # default same
  reference_colors  = c("yellow", "powderblue"),             # default same
  ci_column_spaces  = 25,                                    # default 20
  conf.level        = 0.95,                                  # default 0.95
  theme             = my_theme,                              # default NULL
  outcome_type      = NULL,                                  # default NULL; auto-detect
  effect_measure    = NULL,                                  # default NULL; auto-detect
  offset.name       = NULL,                                  # default NULL
  extreme_ci_cap    = 1.5,                                   # default 1.5
  xlim_method       = "clinical"                             # default "clinical"; or "data"
)


# Option 2: Custom sizing
# All render_forestplot() parameters shown with their defaults.
render_forestplot(
  x       = result,                                          # required
  newpage = TRUE                                             # default TRUE
)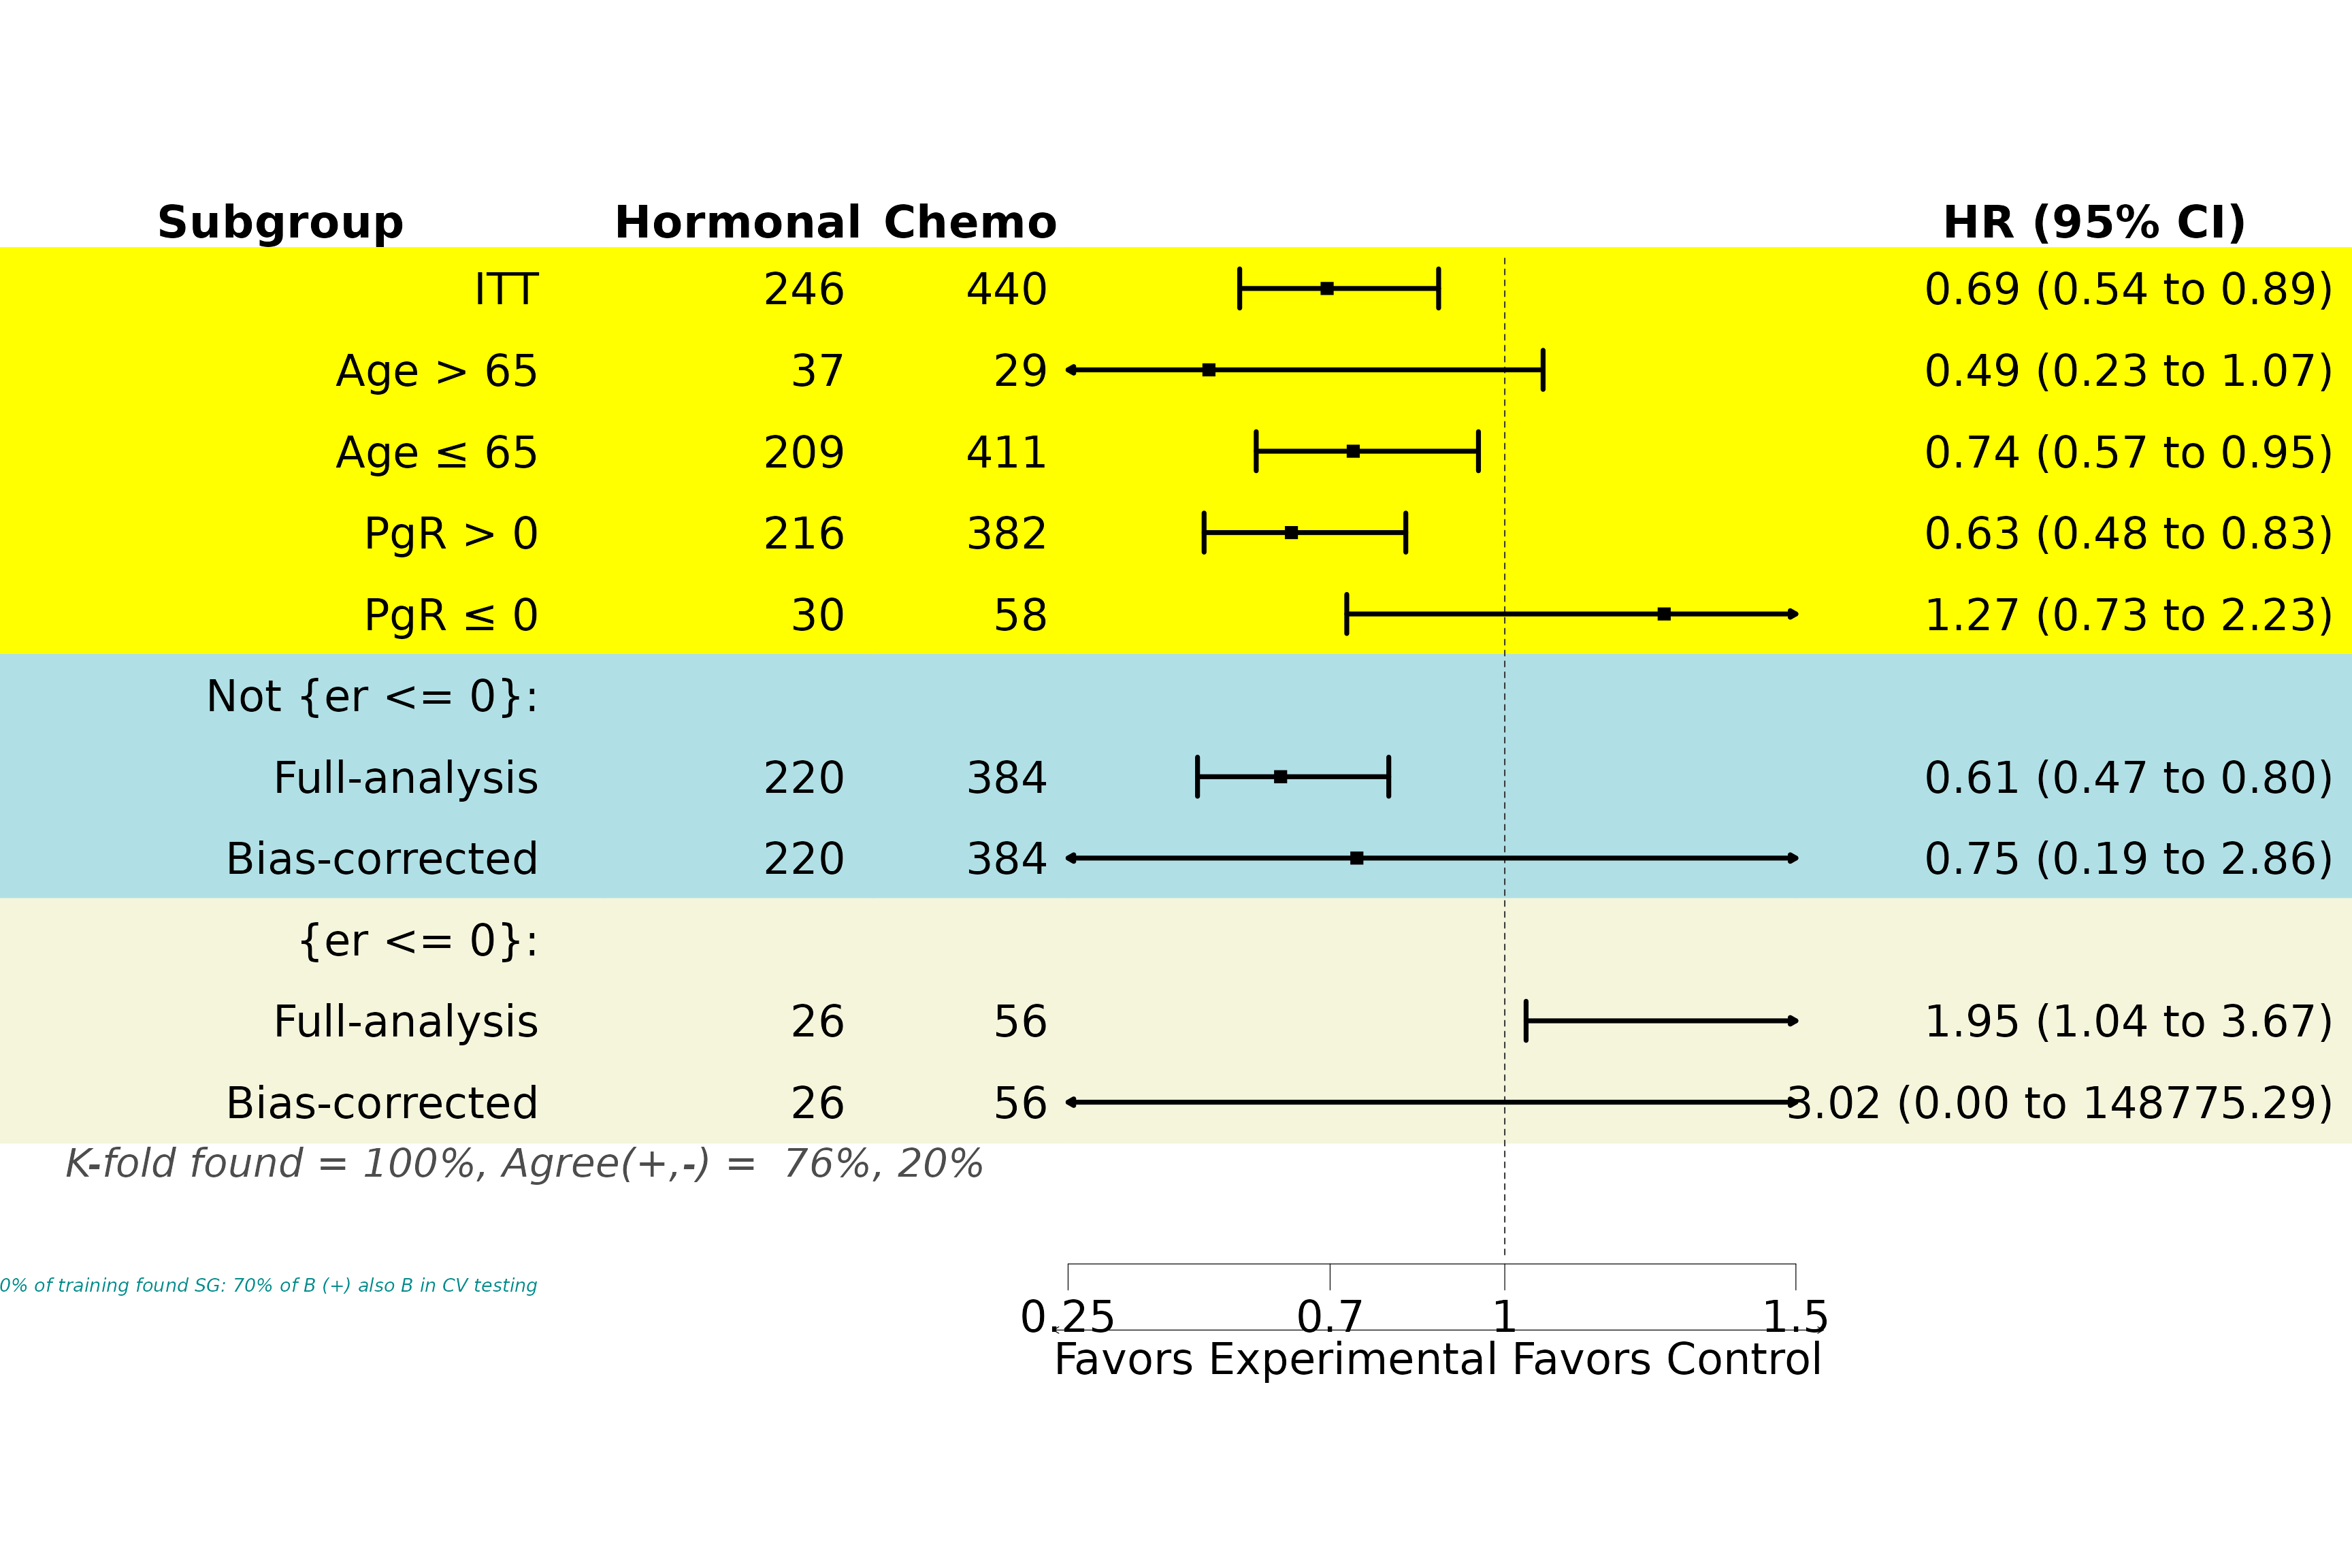
Subgroup forest plot including identified subgroups
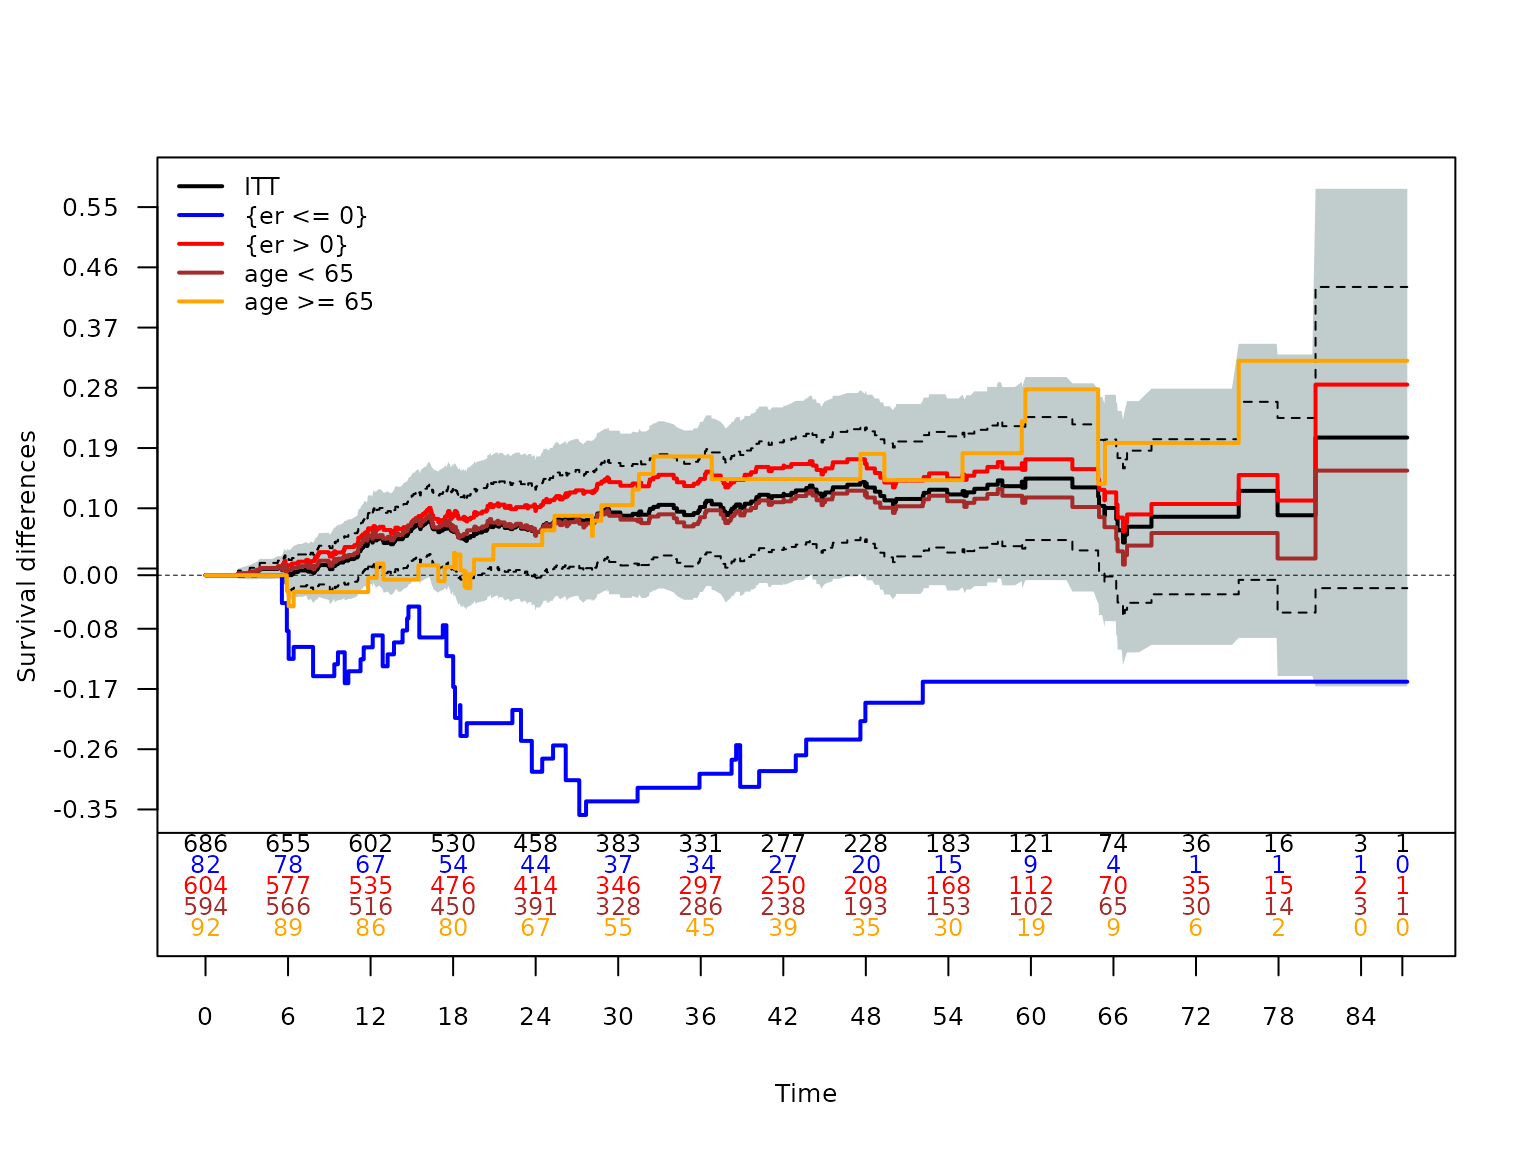
KM Difference plots: ITT and subgroups
The solid black line denotes the ITT Kaplan-Meier treatment difference estimates along with 95% CIs (the grey shaded region). K-M differences corresponding to subgroups are displayed.
# Add additional subgroups along with ITT and identified subgroups
ref_sgs <- list(
age_young = list(subset_expr = "age < 65", color = "brown"),
age_old = list(subset_expr = "age >= 65", color = "orange")
)

# All plot_km_band_forestsearch() parameters shown with their defaults.
plot_km_band_forestsearch(
  df             = df.analysis,                              # required
  fs.est         = fs,                                       # default NULL
  sg_cols        = NULL,                                     # default NULL
  sg_labels      = NULL,                                     # default NULL
  sg_colors      = NULL,                                     # default NULL
  itt_color      = "azure3",                                 # default "azure3"
  outcome.name   = outcome.name,                             # default "tte"
  event.name     = event.name,                               # default "event"
  treat.name     = treat.name,                               # default "treat"
  xlabel         = "Time",                                   # default "Time"
  ylabel         = "Survival differences",                   # default "Survival differences"
  yseq_length    = 5,                                        # default 5
  draws_band     = 20,                                       # default 1000 (lower for speed)
  tau_add        = NULL,                                     # default NULL
  by_risk        = 6,                                        # default 6
  risk_cex       = 0.75,                                     # default 0.75
  risk_delta     = 0.035,                                    # default 0.035
  risk_pad       = 0.015,                                    # default 0.015
  ymax_pad       = 0.11,                                     # default 0.11
  show_legend    = TRUE,                                     # default TRUE
  legend_pos     = "topleft",                                # default "topleft"
  legend_cex     = 0.75,                                     # default 0.75
  ref_subgroups  = ref_sgs,                                  # default NULL
  verbose        = FALSE                                     # default FALSE
)
# # Example with more subgroups
# ref_sgs <- list(
# pgr_positive = list(subset_expr = "pgr > 0", color ="green"),
# pgr_negative = list(subset_expr = "pgr <= 0", color = "purple"),
# age_young = list(subset_expr = "age < 65", color = "brown"),
# age_old = list(subset_expr = "age >= 65", color = "orange")
# )
Summary and Interpretation
Key Findings
## ============================================================
cat("FORESTSEARCH ANALYSIS SUMMARY\n")## FORESTSEARCH ANALYSIS SUMMARY## ============================================================## Dataset: GBSG (N = 686 )
cat("Outcome: Recurrence-free survival\n\n")## Outcome: Recurrence-free survival
cat("ITT Analysis:\n")## ITT Analysis:
cat(" HR (95% CI): 0.69 (0.54, 0.89)\n\n")## HR (95% CI): 0.69 (0.54, 0.89)
cat("Identified Subgroup (H):\n")## Identified Subgroup (H):## Definition: {er <= 0}
cat("  Size:", sum(fs$df.est$treat.recommend == 0),
    sprintf("(%.1f%%)\n", 100 * mean(fs$df.est$treat.recommend == 0)))
## Size: 82 (12.0%)## Unadjusted HR: 1.95
cat("\nComplement Subgroup (Hc):\n")##
## Complement Subgroup (Hc):
cat("  Size:", sum(fs$df.est$treat.recommend == 1),
    sprintf("(%.1f%%)\n", 100 * mean(fs$df.est$treat.recommend == 1)))
## Size: 604 (88.0%)Clinical Interpretation
The ForestSearch analysis identifies estrogen receptor-negative (ER ≤ 0) patients as a subgroup with potential lack of benefit from hormonal therapy.
Biological plausibility: Tamoxifen is a selective estrogen receptor modulator. Its efficacy depends on ER expression. The finding that ER-negative patients may not benefit is consistent with:
- Mechanistic understanding of tamoxifen action
- Meta-analyses showing no tamoxifen benefit in ER-negative breast cancer
- Clinical guidelines recommending tamoxifen primarily for ER-positive tumors
Caveats:
- This is an exploratory analysis requiring independent validation
- The bias-corrected estimates have wider confidence intervals
- Cross-validation metrics should be evaluated for algorithm stability
Computational Timing
| Computational Timing | ||
| Component | Time (sec) | Time (min) |
|---|---|---|
| GRF | 1.3 | 0.0 |
| ForestSearch | 5.3 | 0.1 |
| Bootstrap | 10.0 | 0.2 |
| Total | 30.8 | 0.5 |
timings$total <- (proc.time() - t_vignette_start)["elapsed"]

timing_df <- data.frame(
  Analysis = c("GRF", "ForestSearch", "Bootstrap", "Total"),
  Seconds = c(
    timings$grf,
    timings$forestsearch,
    timings$bootstrap,
    timings$total
  )
)
timing_df$Minutes <- timing_df$Seconds / 60

gt(timing_df) |>
  tab_header(title = "Computational Timing") |>
  fmt_number(columns = c(Seconds, Minutes), decimals = 1) |>
  cols_label(
    Analysis = "Component",
    Seconds = "Time (sec)",
    Minutes = "Time (min)"
  )
References
León LF, Jemielita T, Guo Z, Marceau West R, Anderson KM (2024). “Exploratory subgroup identification in the heterogeneous Cox model: A relatively simple procedure.” Statistics in Medicine. DOI: 10.1002/sim.10163
Session Information
## R version 4.6.2 (2026-10-29)
## Platform: x86_64-pc-linux-gnu
## Running under: Ubuntu 24.04.5 LTS
##
## Matrix products: default
## BLAS:   /usr/lib/x86_64-linux-gnu/openblas-pthread/libblas.so.3
## LAPACK: /usr/lib/x86_64-linux-gnu/openblas-pthread/libopenblasp-r0.3.26.so;  LAPACK version 3.12.0
##
## locale:
##  [1] LC_CTYPE=C.UTF-8       LC_NUMERIC=C           LC_TIME=C.UTF-8
##  [4] LC_COLLATE=C.UTF-8     LC_MONETARY=C.UTF-8    LC_MESSAGES=C.UTF-8
##  [7] LC_PAPER=C.UTF-8       LC_NAME=C              LC_ADDRESS=C
## [10] LC_TELEPHONE=C         LC_MEASUREMENT=C.UTF-8 LC_IDENTIFICATION=C
##
## time zone: UTC
## tzcode source: system (glibc)
##
## attached base packages:
## [1] stats     graphics  grDevices utils     datasets  methods   base
##
## other attached packages:
##  [1] weightedsurv_0.1.0  patchwork_1.3.2     doFuture_1.4.0
##  [4] future_1.80.0       foreach_1.5.2       policytree_1.2.5
##  [7] grf_2.6.1           gt_1.4.0            ggplot2_4.0.3
## [10] data.table_1.18.6.1 survival_3.8-12     forestsearch_0.4.0
##
## loaded via a namespace (and not attached):
##  [1] gtable_0.3.6         shape_1.4.6.1        xfun_0.62
##  [4] bslib_0.12.0         htmlwidgets_1.6.4    visNetwork_2.1.4
##  [7] lattice_0.23-1       vctrs_0.7.3          tools_4.6.2
## [10] generics_0.1.4       parallel_4.6.2       tibble_3.3.1
## [13] pkgconfig_2.0.3      Matrix_1.7-6         forestploter_1.2.0
## [16] RColorBrewer_1.1-3   S7_0.2.2             desc_1.4.3
## [19] lifecycle_1.0.5      compiler_4.6.2       farver_2.1.2
## [22] textshaping_1.0.5    codetools_0.2-20     litedown_0.11
## [25] htmltools_0.5.9      sass_0.4.10          yaml_2.3.12
## [28] glmnet_5.2           pillar_1.11.1        pkgdown_2.2.1
## [31] jquerylib_0.1.4      cachem_1.1.0         iterators_1.0.14
## [34] parallelly_1.48.0    commonmark_2.0.0     tidyselect_1.2.1
## [37] digest_0.6.39        mvtnorm_1.4-2        dplyr_1.2.1
## [40] listenv_1.1.0        labeling_0.4.3       splines_4.6.2
## [43] fastmap_1.2.0        grid_4.6.2           cli_3.6.6
## [46] magrittr_2.0.5       DiagrammeR_1.0.12    randomForest_4.7-1.2
## [49] future.apply_1.21.0  withr_3.0.3          scales_1.4.0
## [52] rmarkdown_2.32       globals_0.20.0       otel_0.2.0
## [55] gridExtra_2.3.1      progressr_1.1.0      ragg_1.5.2
## [58] evaluate_1.0.5       knitr_1.52           markdown_2.1
## [61] rlang_1.3.0          Rcpp_1.1.2           glue_1.8.1
## [64] xml2_1.6.0           rstudioapi_0.19.0    jsonlite_2.0.0
## [67] R6_2.6.1             systemfonts_1.3.2    fs_2.1.0