Comprehensive Wrapper for Cox Spline Analysis with AHR and CDE Plotting
Source:R/cox_ahr_cde_wrapper.R
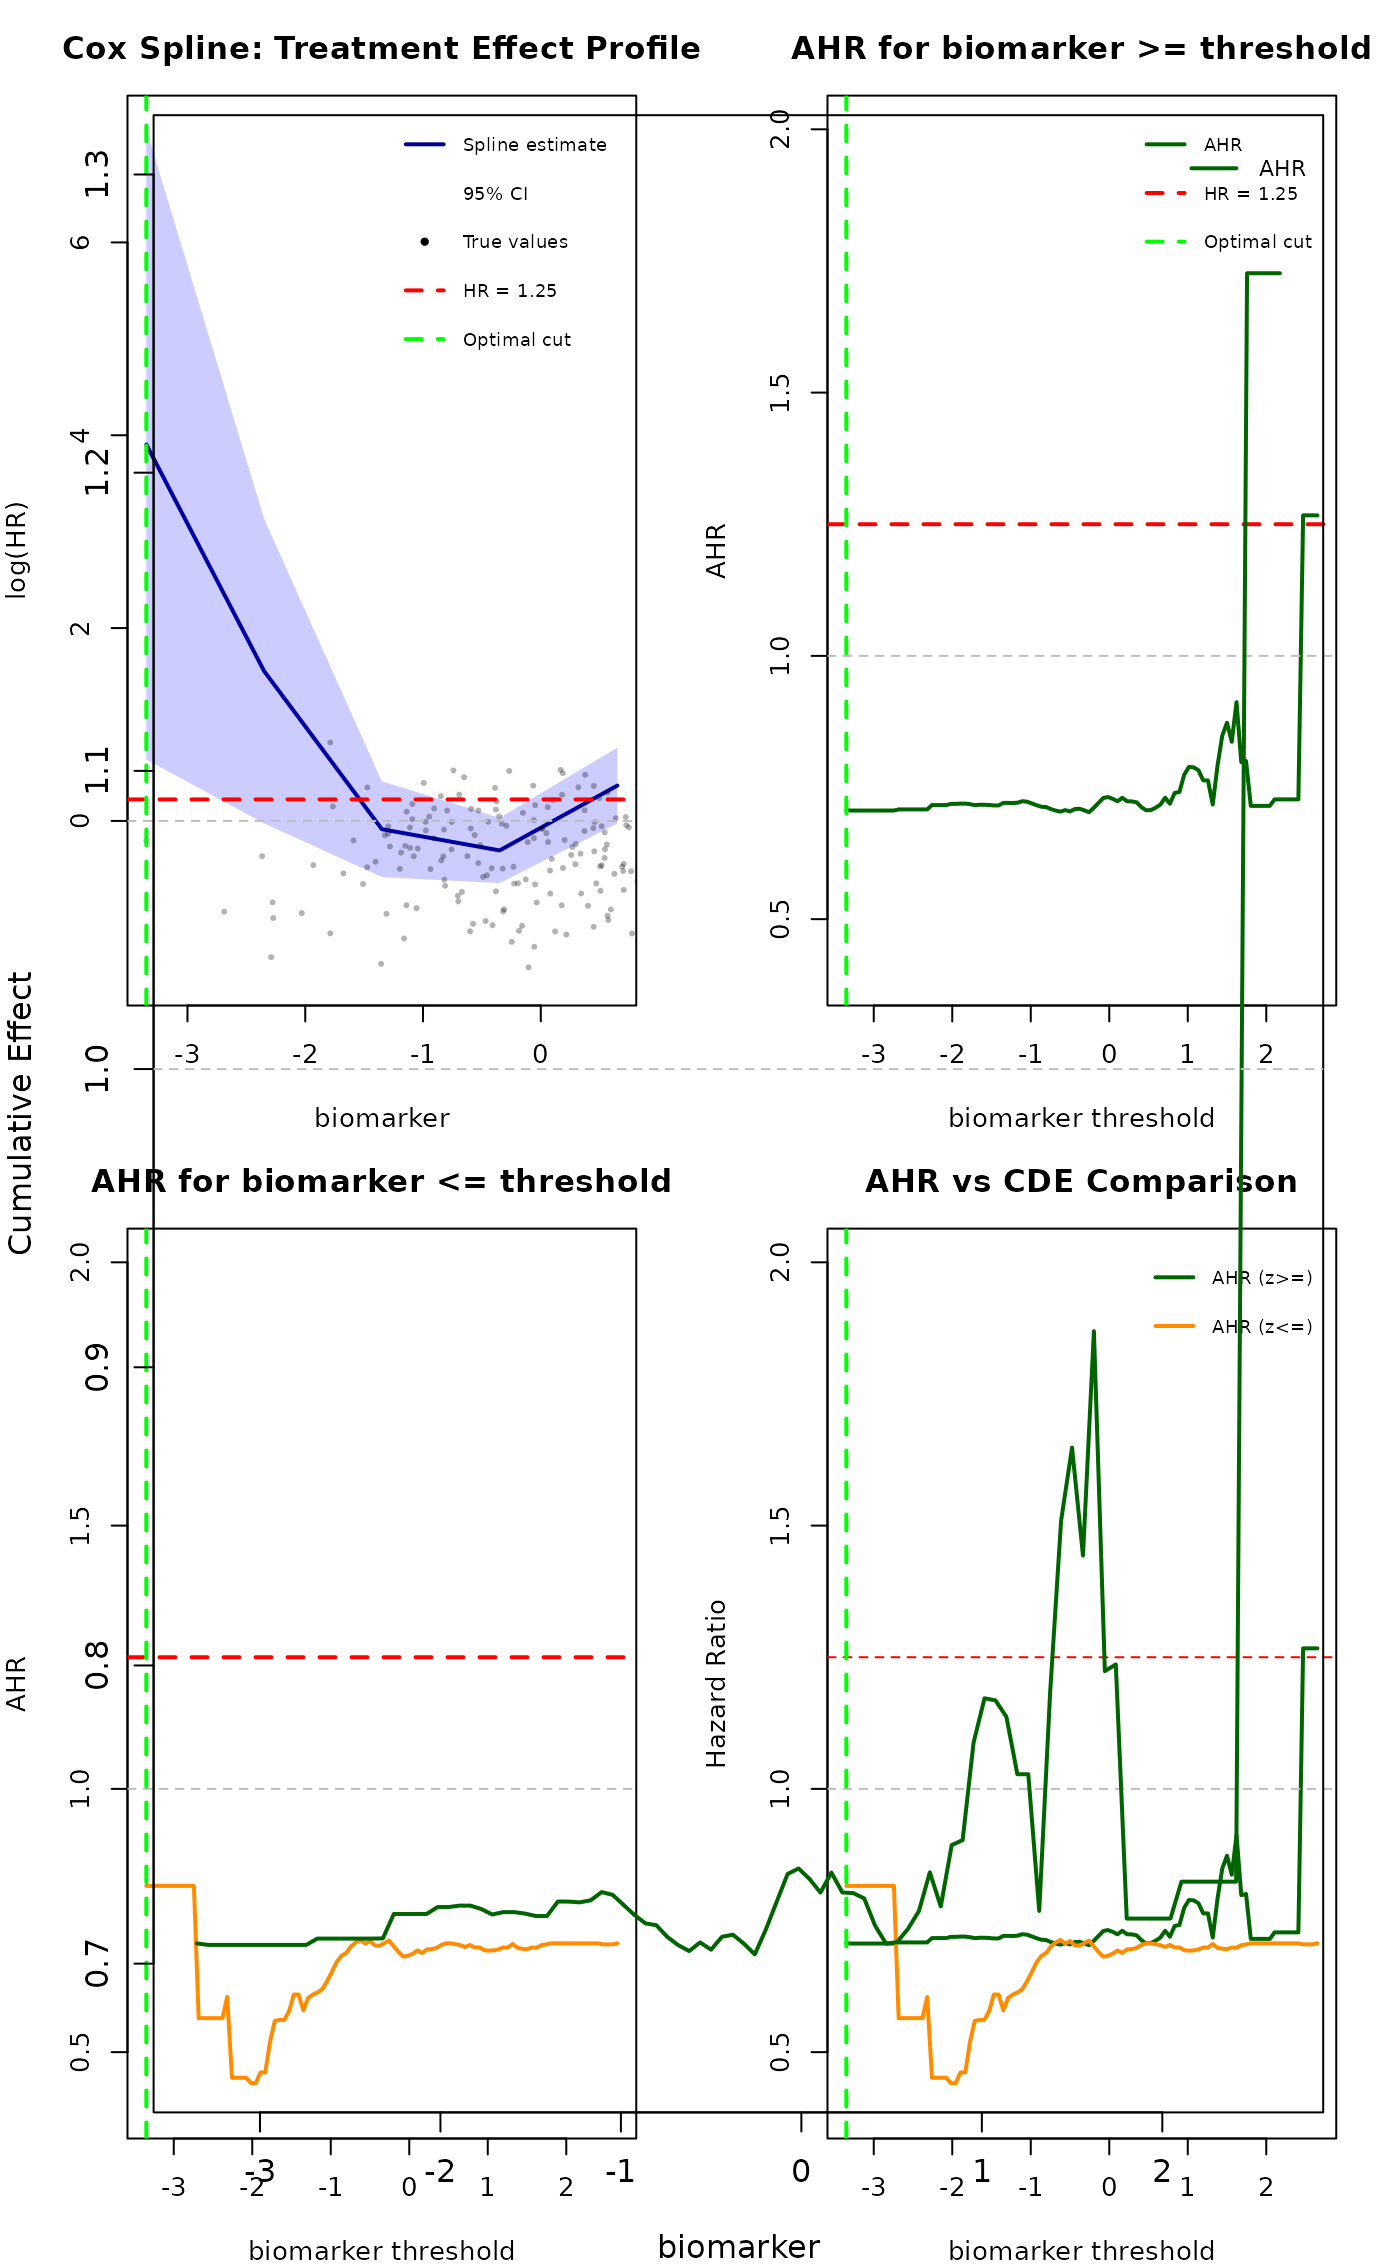
cox_ahr_cde_analysis.RdThis wrapper function combines Cox spline fitting with comprehensive visualization of Average Hazard Ratios (AHRs) and Controlled Direct Effects (CDEs) as described in the MRCT subgroups analysis documentation.
Usage
cox_ahr_cde_analysis(
  df,
  tte_name = "os_time",
  event_name = "os_event",
  treat_name = "treat",
  z_name = "biomarker",
  loghr_po_name = "loghr_po",
  theta1_name = "theta_1",
  theta0_name = "theta_0",
  spline_df = 3,
  alpha = 0.2,
  hr_threshold = 0.7,
  plot_style = c("combined", "separate", "grid"),
  plot_select = c("all", "profile_ahr", "ahr_only"),
  save_plots = FALSE,
  output_dir = tempdir(),
  verbose = TRUE
)
Arguments
- df
Data frame containing survival data with potential outcomes.
- tte_name
Character string specifying time-to-event variable name. Default:
"os_time".- event_name
Character string specifying event indicator variable name. Default:
"os_event".- treat_name
Character string specifying treatment variable name. Default:
"treat".- z_name
Character string specifying continuous covariate/biomarker name. Default:
"biomarker".- loghr_po_name
Character string specifying potential outcome log HR variable. Default:
"loghr_po".- theta1_name
Optional: variable name for theta_1 (treated potential outcome). Default:
"theta_1".- theta0_name
Optional: variable name for theta_0 (control potential outcome). Default:
"theta_0".- spline_df
Integer degrees of freedom for spline fitting. Default: 3.
- alpha
Numeric significance level for confidence intervals. Default: 0.20.
- hr_threshold
Numeric hazard ratio threshold for subgroup identification, or
NULLto suppress threshold-based elements. WhenNULL, plots omit the HR threshold line, optimal cutpoint line, and subgroup-dependent panels (Plots 5–6); subgroup statistics report only the overall population. Default: 0.7.- plot_style
Character:
"combined","separate", or"grid"for plot layout. Default:"combined".- plot_select
Character controlling which panels to display:
"all"(default) shows the full grid layout;"profile_ahr"shows only the treatment effect profile (top-left) and the AHR curve for \(z \geq\) threshold (top-middle) side by side, with the AHR panel's y-axis scaled to the data range;"ahr_only"shows only the AHR curve for \(z \geq\) threshold as a single panel with self-contained y-axis.- save_plots
Logical whether to save plots to file. Default: FALSE.
- output_dir
Character directory for saving plots. Default:
tempdir().- verbose
Logical for diagnostic output. Default: TRUE.
Value
List of class "cox_ahr_cde" containing:
- cox_fit
Results from
cox_cs_fitfunction.- ahr_results
AHR calculations for different subgroup definitions.
- cde_results
CDE calculations if theta variables available.
- optimal_cutpoint
Optimal biomarker cutpoint, or
NULLwhenhr_thresholdisNULL.- subgroup_stats
Statistics for recommended and questionable subgroups, or overall-only when
hr_thresholdisNULL.- data
List with z_values, loghr_po, and subgroup assignments.
Examples
# \donttest{
# Build a small synthetic dataset with required columns
set.seed(42)
n <- 200
df_ex <- data.frame(
  os_time   = rexp(n, rate = 0.01),
  os_event  = rbinom(n, 1, 0.6),
  treat     = rep(0:1, each = n / 2),
  biomarker = rnorm(n),
  loghr_po  = rnorm(n, mean = -0.3, sd = 0.5)
)

# With threshold - full subgroup analysis
results <- cox_ahr_cde_analysis(
  df = df_ex, z_name = "biomarker",
  hr_threshold = 1.25, plot_style = "grid",
  verbose = FALSE
)

# Without threshold - pure AHR curves
results <- cox_ahr_cde_analysis(
  df = df_ex, z_name = "biomarker",
  hr_threshold = NULL, plot_select = "ahr_only",
  verbose = FALSE
)
# }